

Standardization of electrolyte leakage data and a novel liquid nitrogen control improve measurements of cold hardiness in woody tissue
- PMID: 34022929
- PMCID: PMC8140579
- DOI: 10.1186/s13007-021-00755-0
Standardization of electrolyte leakage data and a novel liquid nitrogen control improve measurements of cold hardiness in woody tissue
Abstract
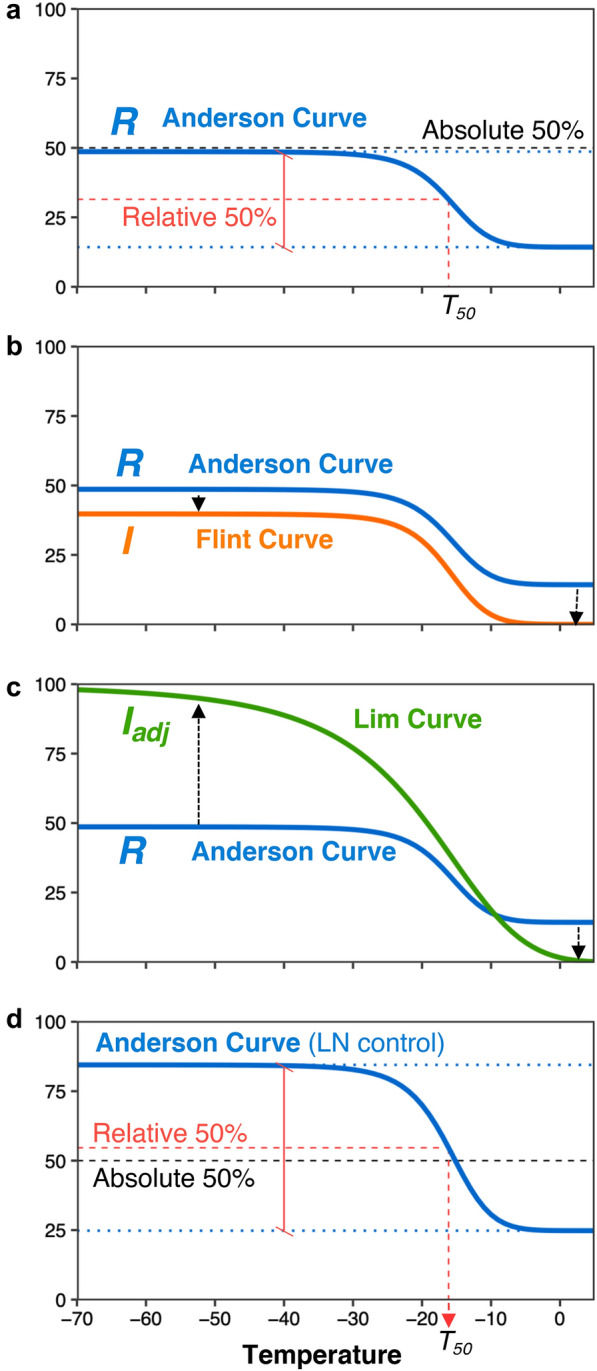
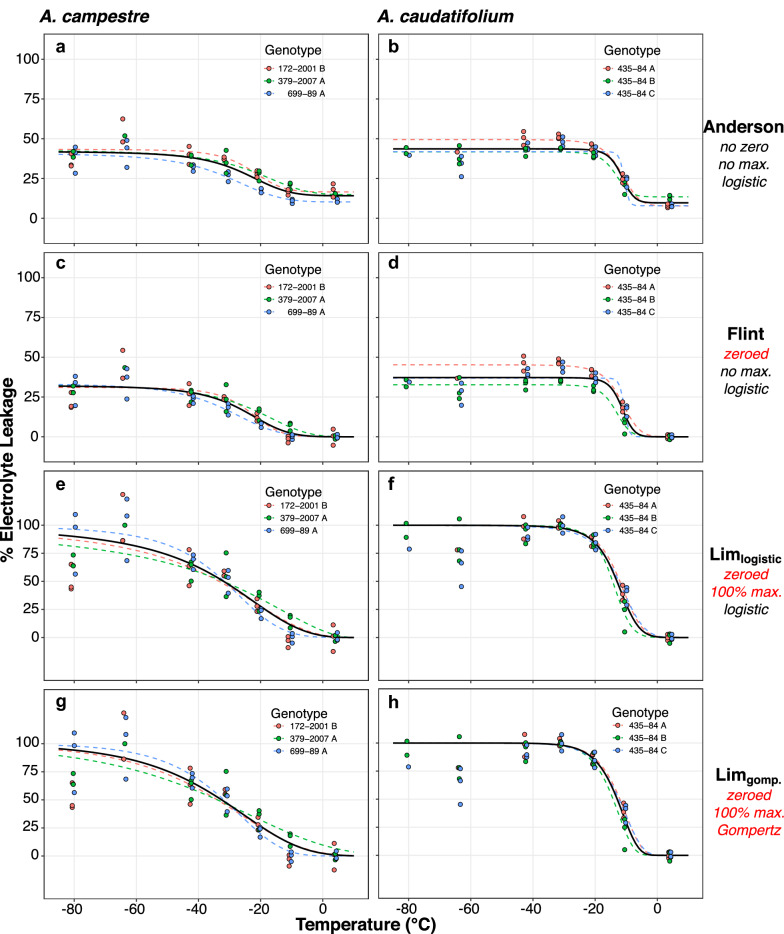
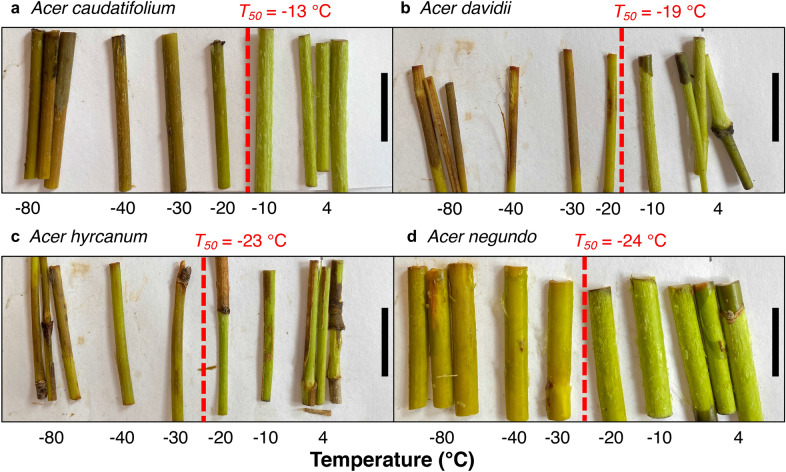
Background: A variety of basic and applied research programs in plant biology require the accurate and reliable determination of plant tissue cold hardiness. Over the past 50 years, the electrolyte leakage method has emerged as a popular and practical method for quantifying the amount of damage inflicted on plant tissue by exposure to freezing temperatures. Numerous approaches for carrying out this method and analyzing the resultant data have emerged. These include multiple systems for standardizing and modeling raw electrolyte leakage data and multiple protocols for boiling or autoclaving samples in order to maximize leakage as a positive control. We compare four different routines for standardization of leakage data and assess a novel control method-immersion in liquid nitrogen in lieu of traditional autoclaving-and apply them to woody twigs collected from 12 maple (Acer) species in early spring. We compare leakage data from these samples using each of four previously published forms of data analysis and autoclaving vs. liquid nitrogen controls and validate each of these approaches against visual estimates of freezing damage and differential thermal analysis.
Results: Through presentation of our own data and re-analysis of previously published findings, we show that standardization of raw data against estimates of both minimum and maximum attainable freezing damage allows for reliable estimation of cold hardiness at the species level and across studies in diverse systems. Furthermore, use of our novel liquid nitrogen control produces data commensurate across studies and enhances the consistency and realism of the electrolyte leakage method, especially for very cold hardy samples.
Conclusion: Future leakage studies that relativize data against minimum and maximum leakage and that employ our updated liquid nitrogen control will contribute generalizable, repeatable, and realistic data to the existing body of cold hardiness research in woody plants. Data from studies conducted using a liquid nitrogen (and not an autoclaving) control can still be compared to previously published data, especially when raw data are standardized using the best-performing approach among those we assessed. Electrolyte leakage of woody twigs emerges as a useful technique for quickly assessing the probability of tissue death in response to freezing in dormant plants. Differential thermal analysis may provide different and complementary information on cold hardiness.
Keywords: Acer; Cold hardiness; Differential thermal analysis; Electrolyte leakage; Freezing tolerance; Maple.
Conflict of interest statement
The authors declare that they have no competing interests.
Figures


Similar articles
-
Use of electrolyte leakage to assess floral damage after freezing.Appl Plant Sci. 2024 Feb 19;12(5):e11569. doi: 10.1002/aps3.11569. eCollection 2024 Sep-Oct. Appl Plant Sci. 2024. PMID: 39360192 Free PMC article.
-
Local conditions have greater influence than provenance on sugar maple (Acer saccharum Marsh.) frost hardiness at its northern range limit.Tree Physiol. 2025 Jan 25;45(1):tpae167. doi: 10.1093/treephys/tpae167. Tree Physiol. 2025. PMID: 39728919 Free PMC article.
-
Whole-plant frost hardiness of mycorrhizal (Hebeloma sp. or Suillus luteus) and non-mycorrhizal Scots pine seedlings.Tree Physiol. 2019 Apr 1;39(4):526-535. doi: 10.1093/treephys/tpy105. Tree Physiol. 2019. PMID: 30371901
-
Cold Hardiness in Trees: A Mini-Review.Front Plant Sci. 2018 Sep 20;9:1394. doi: 10.3389/fpls.2018.01394. eCollection 2018. Front Plant Sci. 2018. PMID: 30294340 Free PMC article. Review.
-
Ice Nucleation Activity in Plants: The Distribution, Characterization, and Their Roles in Cold Hardiness Mechanisms.Adv Exp Med Biol. 2018;1081:99-115. doi: 10.1007/978-981-13-1244-1_6. Adv Exp Med Biol. 2018. PMID: 30288706 Review.
Cited by
-
Weighing the risks and benefits of flowering early in the spring for the woody perennial Prunus pumila.Am J Bot. 2024 Nov;111(11):e16417. doi: 10.1002/ajb2.16417. Epub 2024 Oct 18. Am J Bot. 2024. PMID: 39425253 Free PMC article.
-
Floral freezing tolerance is tied to flowering time in North American woody plant species.Ann Bot. 2025 Feb 8;135(1-2):305-316. doi: 10.1093/aob/mcae117. Ann Bot. 2025. PMID: 39066503 Free PMC article.
-
Leaf Membrane Stability under High Temperatures as an Indicator of Heat Tolerance in Potatoes and Genome-Wide Association Studies to Understand the Underlying Genetics.Plants (Basel). 2024 Aug 6;13(16):2175. doi: 10.3390/plants13162175. Plants (Basel). 2024. PMID: 39204611 Free PMC article.
-
Use of electrolyte leakage to assess floral damage after freezing.Appl Plant Sci. 2024 Feb 19;12(5):e11569. doi: 10.1002/aps3.11569. eCollection 2024 Sep-Oct. Appl Plant Sci. 2024. PMID: 39360192 Free PMC article.
-
Genome-Wide Analysis of ZAT Gene Family in Osmanthus fragrans and the Function Exploration of OfZAT35 in Cold Stress.Plants (Basel). 2023 Jun 16;12(12):2346. doi: 10.3390/plants12122346. Plants (Basel). 2023. PMID: 37375971 Free PMC article.
References
-
- Muffler L, Beierkuhnlein C, Aas G, Jentsch A, Schweiger AH, Zohner C, et al. Distribution ranges and spring phenology explain late frost sensitivity in 170 woody plants from the Northern Hemisphere. Glob Ecol Biogeogr. 2016;25:1061–1071. doi: 10.1111/geb.12466. - DOI
LinkOut - more resources
Full Text Sources
Other Literature Sources
Miscellaneous
