

Quantitative proteomic comparison of salt stress in Chlamydomonas reinhardtii and the snow alga Chlamydomonas nivalis reveals mechanisms for salt-triggered fatty acid accumulation via reallocation of carbon resources
- PMID: 34022944
- PMCID: PMC8141184
- DOI: 10.1186/s13068-021-01970-6
Quantitative proteomic comparison of salt stress in Chlamydomonas reinhardtii and the snow alga Chlamydomonas nivalis reveals mechanisms for salt-triggered fatty acid accumulation via reallocation of carbon resources
Abstract
Background: Chlamydomonas reinhardtii is a model green alga strain for molecular studies; its fully sequenced genome has enabled omic-based analyses that have been applied to better understand its metabolic responses to stress. Here, we characterised physiological and proteomic changes between a low-starch C. reinhardtii strain and the snow alga Chlamydomonas nivalis, to reveal insights into their contrasting responses to salinity stress.
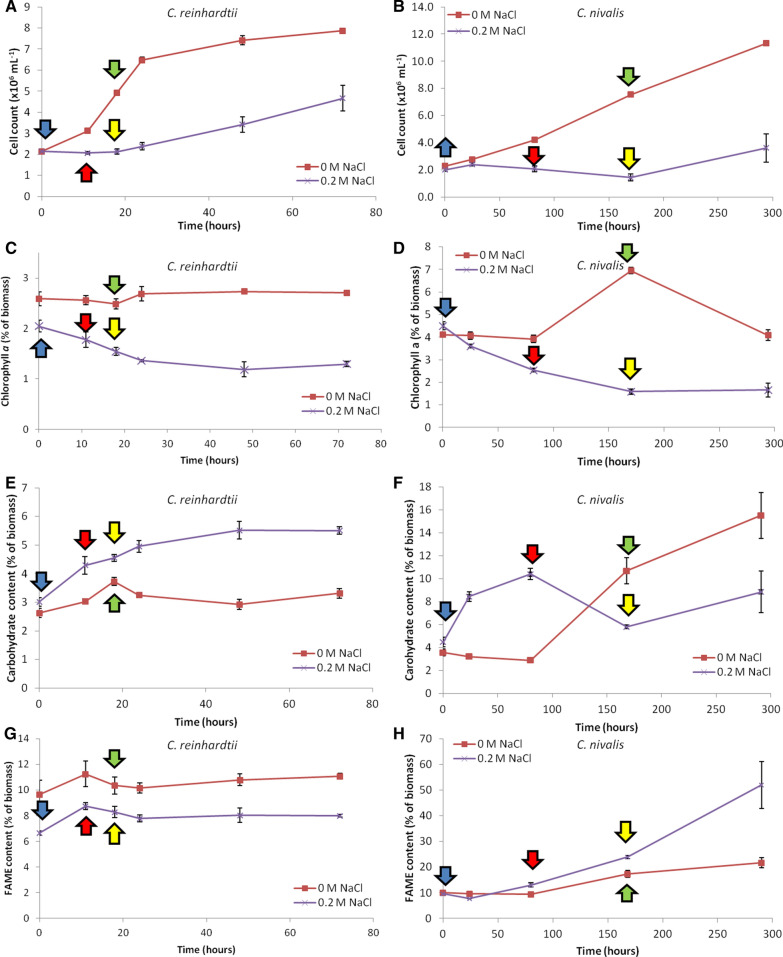
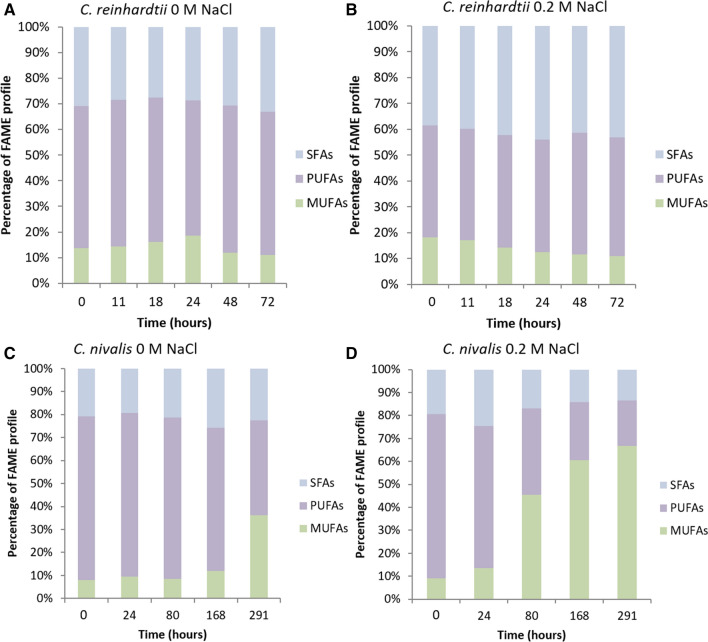
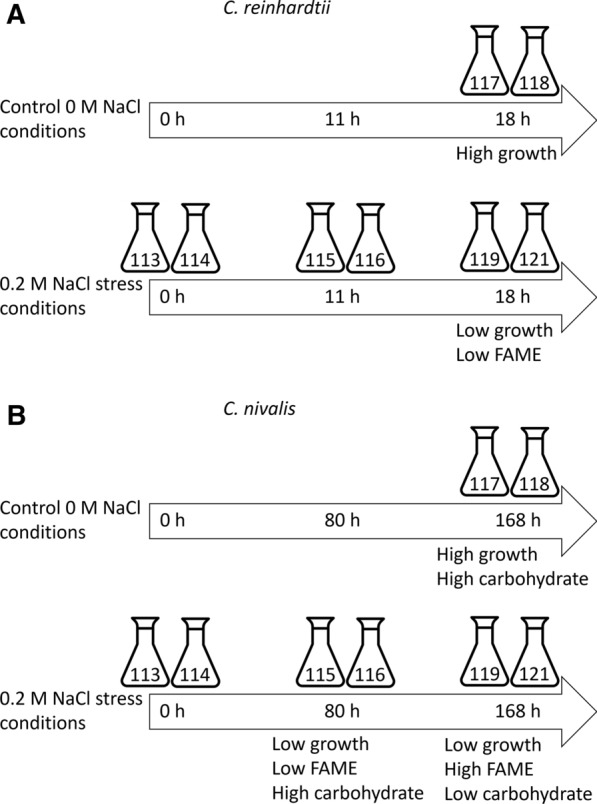
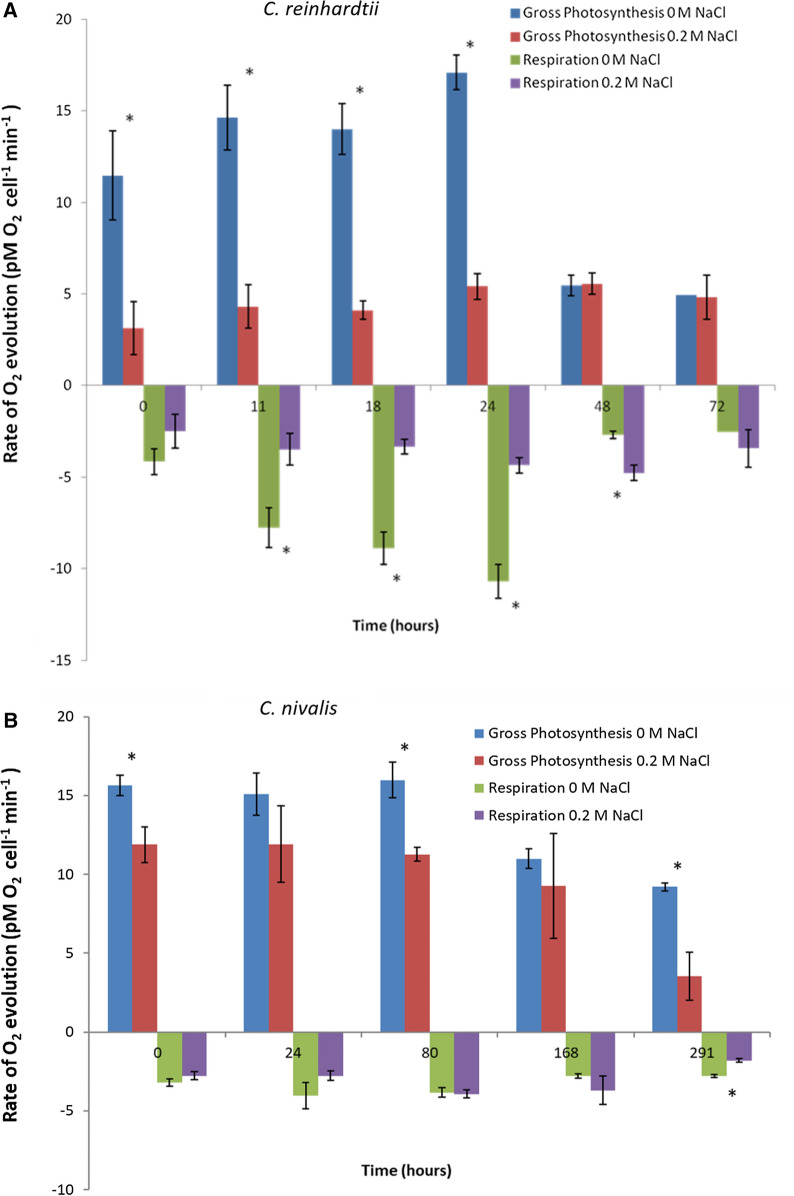
Results: Each strain was grown in conditions tailored to their growth requirements to encourage maximal fatty acid (as a proxy measure of lipid) production, with internal controls to allow comparison points. In 0.2 M NaCl, C. nivalis accumulates carbohydrates up to 10.4% DCW at 80 h, and fatty acids up to 52.0% dry cell weight (DCW) over 12 days, however, C. reinhardtii does not show fatty acid accumulation over time, and shows limited carbohydrate accumulation up to 5.5% DCW. Analysis of the C. nivalis fatty acid profiles showed that salt stress improved the biofuel qualities over time. Photosynthesis and respiration rates are reduced in C. reinhardtii relative to C. nivalis in response to 0.2 M NaCl. De novo sequencing and homology matching was used in conjunction with iTRAQ-based quantitative analysis to identify and relatively quantify proteomic alterations in cells exposed to salt stress. There were abundance differences in proteins associated with stress, photosynthesis, carbohydrate and lipid metabolism proteins. In terms of lipid synthesis, salt stress induced an increase in dihydrolipoyl dehydrogenase in C. nivalis (1.1-fold change), whilst levels in C. reinhardtii remained unaffected; this enzyme is involved in acetyl CoA production and has been linked to TAG accumulation in microalgae. In salt-stressed C. nivalis there were decreases in the abundance of UDP-sulfoquinovose (- 1.77-fold change), which is involved in sulfoquinovosyl diacylglycerol metabolism, and in citrate synthase (- 2.7-fold change), also involved in the TCA cycle. Decreases in these enzymes have been shown to lead to increased TAG production as fatty acid biosynthesis is favoured. Data are available via ProteomeXchange with identifier PXD018148.
Conclusions: These differences in protein abundance have given greater understanding of the mechanism by which salt stress promotes fatty acid accumulation in the un-sequenced microalga C. nivalis as it switches to a non-growth state, whereas C. reinhardtii does not have this response.
Keywords: Biofuel; Chlamydomonas nivalis; Chlamydomonas reinhardtii; Fatty acid production; Quantitative proteomics; Salt stress.
Conflict of interest statement
The authors declare that they have no competing interests.
Figures
Similar articles
-
Metabolic and gene expression changes triggered by nitrogen deprivation in the photoautotrophically grown microalgae Chlamydomonas reinhardtii and Coccomyxa sp. C-169.Phytochemistry. 2012 Mar;75:50-9. doi: 10.1016/j.phytochem.2011.12.007. Epub 2012 Jan 5. Phytochemistry. 2012. PMID: 22226037
-
Cold Adaptation Mechanisms of a Snow Alga Chlamydomonas nivalis During Temperature Fluctuations.Front Microbiol. 2021 Jan 11;11:611080. doi: 10.3389/fmicb.2020.611080. eCollection 2020. Front Microbiol. 2021. PMID: 33584575 Free PMC article.
-
Identification of Salt Stress Responding Genes Using Transcriptome Analysis in Green Alga Chlamydomonas reinhardtii.Int J Mol Sci. 2018 Oct 26;19(11):3359. doi: 10.3390/ijms19113359. Int J Mol Sci. 2018. PMID: 30373210 Free PMC article.
-
Oil accumulation in the model green alga Chlamydomonas reinhardtii: characterization, variability between common laboratory strains and relationship with starch reserves.BMC Biotechnol. 2011 Jan 21;11:7. doi: 10.1186/1472-6750-11-7. BMC Biotechnol. 2011. PMID: 21255402 Free PMC article.
-
Detailed identification of fatty acid isomers sheds light on the probable precursors of triacylglycerol accumulation in photoautotrophically grown Chlamydomonas reinhardtii.Eukaryot Cell. 2014 Feb;13(2):256-66. doi: 10.1128/EC.00280-13. Epub 2013 Dec 13. Eukaryot Cell. 2014. PMID: 24337111 Free PMC article.
Cited by
-
Comprehensive Time-Course Transcriptome and Co-expression Network Analyses Identify Salt Stress Responding Mechanisms in Chlamydomonas reinhardtii Strain GY-D55.Front Plant Sci. 2022 Feb 24;13:828321. doi: 10.3389/fpls.2022.828321. eCollection 2022. Front Plant Sci. 2022. PMID: 35283918 Free PMC article.
-
Macrogenomic Analysis Reveals Soil Microbial Diversity in Different Regions of the Antarctic Peninsula.Microorganisms. 2024 Nov 27;12(12):2444. doi: 10.3390/microorganisms12122444. Microorganisms. 2024. PMID: 39770646 Free PMC article.
-
Microalgae biofuels: illuminating the path to a sustainable future amidst challenges and opportunities.Biotechnol Biofuels Bioprod. 2024 Jan 23;17(1):10. doi: 10.1186/s13068-024-02461-0. Biotechnol Biofuels Bioprod. 2024. PMID: 38254224 Free PMC article. Review.
-
Evaluation of Shifts of Gene Transcription Levels of Unicellular Green Alga Chlamydomonas reinhardtii Due to UV-C Irradiation.Microorganisms. 2023 Mar 1;11(3):633. doi: 10.3390/microorganisms11030633. Microorganisms. 2023. PMID: 36985207 Free PMC article.
-
Fatty acid analysis in microalgal mono- and polycultures using diffuse reflectance infrared Fourier transform spectroscopy coupled with partial least squares analysis.Heliyon. 2024 Jun 14;10(12):e33058. doi: 10.1016/j.heliyon.2024.e33058. eCollection 2024 Jun 30. Heliyon. 2024. PMID: 38988580 Free PMC article.
References
-
- Takagi, M., Karseno, and T. Yoshida, Effect of salt concentration on intracellular accumulation of lipids and triacylglyceride in marine microalgae Dunaliella cells. J Biosci Bioeng, 2006. 101(3): p. 223–226. - PubMed
Grants and funding
LinkOut - more resources
Full Text Sources
Other Literature Sources
Molecular Biology Databases
