. 2021 May 22;9(1):121.
doi: 10.1186/s40168-020-00957-z.

Meanders as a scaling motif for understanding of floodplain soil microbiome and biogeochemical potential at the watershed scale

Affiliations

Meanders as a scaling motif for understanding of floodplain soil microbiome and biogeochemical potential at the watershed scale

Paula B Matheus Carnevali et al. Microbiome. .

Abstract

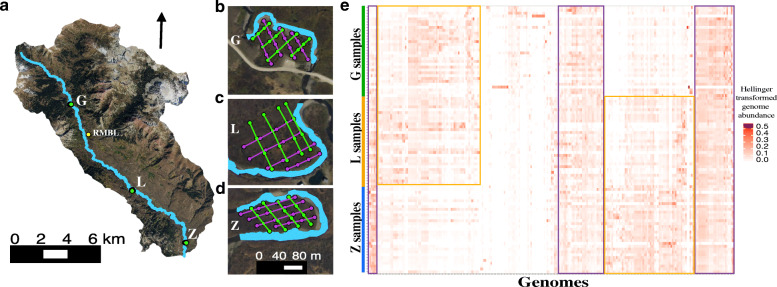
Background: Biogeochemical exports from watersheds are modulated by the activity of microorganisms that function over micron scales. Here, we tested the hypothesis that meander-bound regions share a core microbiome and exhibit patterns of metabolic potential that broadly predict biogeochemical processes in floodplain soils along a river corridor.

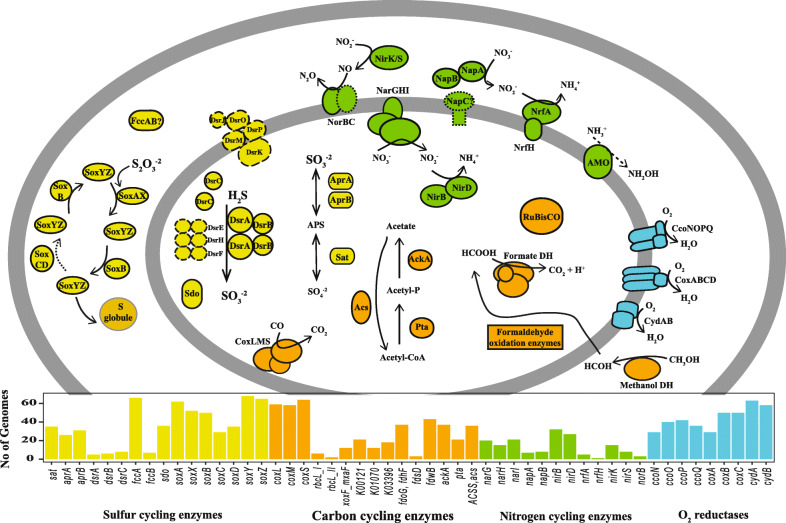
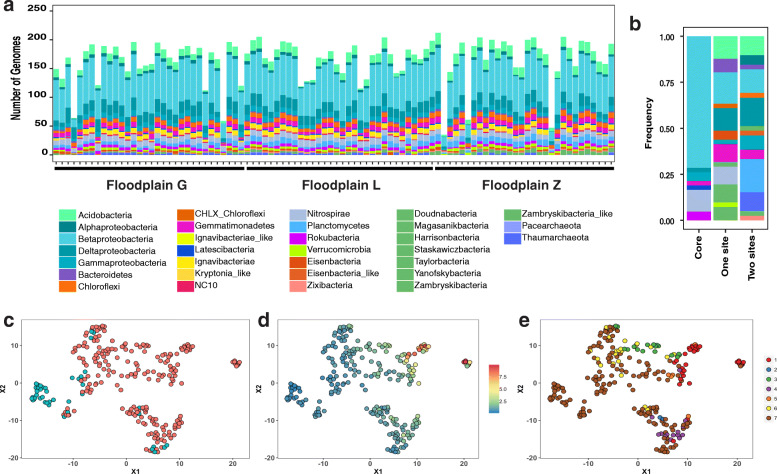
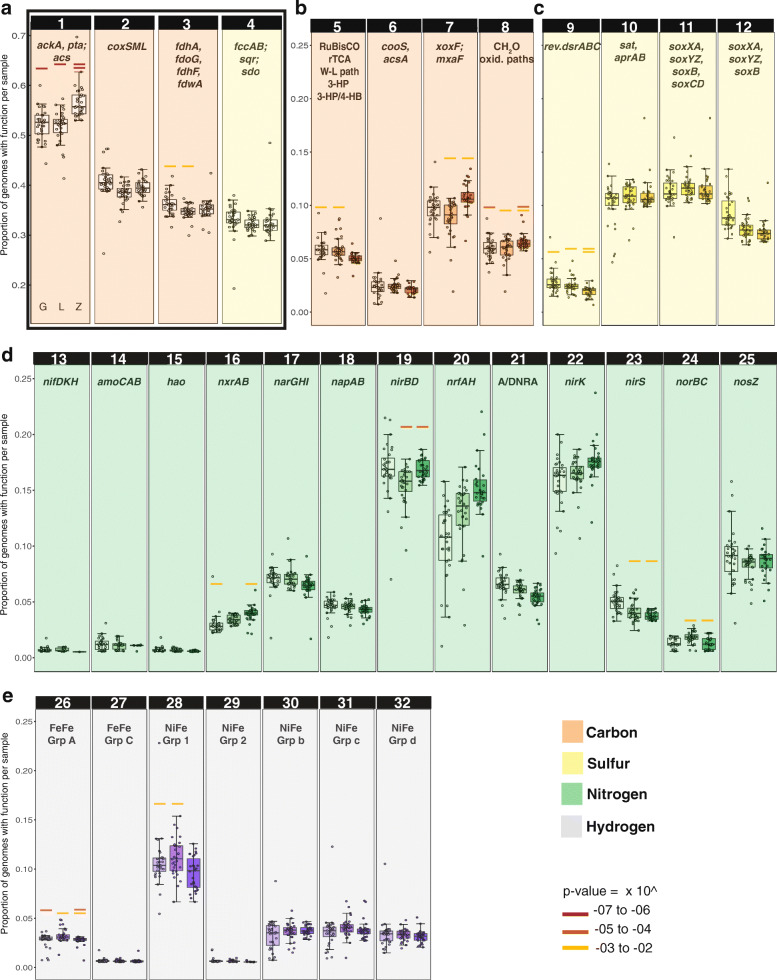
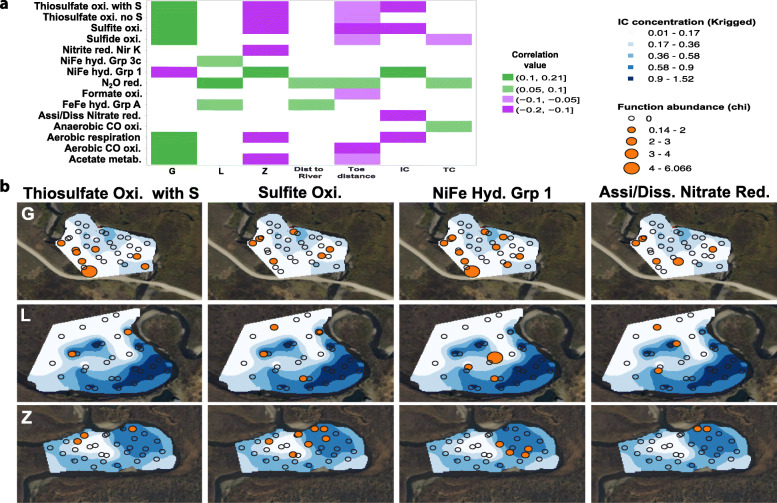
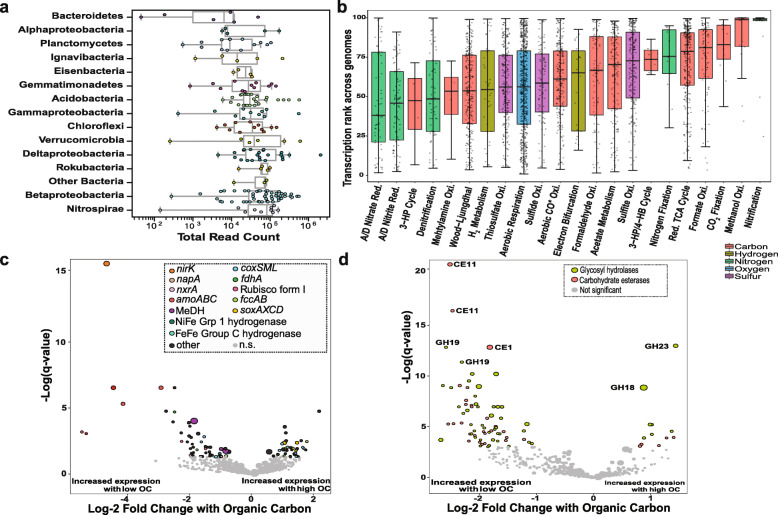
Results: We intensively sampled the microbiomes of floodplain soils located in the upper, middle, and lower reaches of the East River, Colorado. Despite the very high microbial diversity and complexity of the soils, we reconstructed 248 quality draft genomes representative of subspecies. Approximately one third of these bacterial subspecies was detected across all three locations at similar abundance levels, and ~ 15% of species were detected in two consecutive years. Within the meander-bound floodplains, we did not detect systematic patterns of gene abundance based on sampling position relative to the river. However, across meanders, we identified a core floodplain microbiome that is enriched in capacities for aerobic respiration, aerobic CO oxidation, and thiosulfate oxidation with the formation of elemental sulfur. Given this, we conducted a transcriptomic analysis of the middle floodplain. In contrast to predictions made based on the prominence of gene inventories, the most highly transcribed genes were relatively rare amoCAB and nxrAB (for nitrification) genes, followed by genes involved in methanol and formate oxidation, and nitrogen and CO2 fixation. Within all three meanders, low soil organic carbon correlated with high activity of genes involved in methanol, formate, sulfide, hydrogen, and ammonia oxidation, nitrite oxidoreduction, and nitrate and nitrite reduction. Overall, the results emphasize the importance of sulfur, one-carbon and nitrogen compound metabolism in soils of the riparian corridor.

Conclusions: The disparity between the scale of a microbial cell and the scale of a watershed currently limits the development of genomically informed predictive models describing watershed biogeochemical function. Meander-bound floodplains appear to serve as scaling motifs that predict aggregate capacities for biogeochemical transformations, providing a foundation for incorporating riparian soil microbiomes in watershed models. Widely represented genetic capacities did not predict in situ activity at one time point, but rather they define a reservoir of biogeochemical potential available as conditions change. Video abstract.

Keywords: Floodplain; Genome-resolved metagenomics; Metatranscriptomics; Microbiome; Soil; Watershed.


Conflict of interest statement

The authors declare that they have no competing interests.

Figures

Fig. 1
Fig. 1
Sampling sites on the East River watershed and genome detection across samples. a Overview of the East River, CO study site, highlighting the three sampled floodplains (green dots) and the Rocky Mountain Biological Laboratory (RMBL, yellow dot), b meander-bound floodplain G, c meander-bound floodplain L, and d meander-bound floodplain Z. Sampling sites as green and purple dots along two sets of four transects. One set of transects in one direction (in green), and the second set of transects along another direction (in purple). e Hellinger transformed abundance of dereplicated genomes across samples based on cross-mapping. Genomes and samples clustered by average linkage and Euclidean distance respectively
Fig. 2
Fig. 2
Diagram depicting Betaproteobacteria genomes and environmentally relevant capacities encoded by representatives of 98% ANI clusters. Note that no single genome harbors all of these genes, but combinations of them instead (Table S4, Additional File 6). Some genomes harbor methanol dehydrogenases that are potentially able to turn methanol directly into formate (XoxF type). Enzymes delineated with solid lines were predicted using KOFAM HMMs, and the number of genomes (> 1*) encoding those genes are shown in the bar plot. Enzymes that were predicted using methods as part of ggKbase are shown with dashed lines (long dashes) and enzymes or subunits that are presumably encoded are shown with dotted lines. For more information about metabolic potential see Methods section. *AMO was included in this diagram even though it was detected in only 1 genome, to indicate aerobic ammonia oxidation is also possibly carried out by members of this clade
Fig. 3
Fig. 3
Microbial community composition and core floodplain microbiome. a Taxa at the phylum or class level detected across samples and floodplains, samples are in numerical order (Table S1, Additional File 1:) from the upstream to the downstream floodplain. b Taxonomic composition of genomes in the core floodplain microbiome (core), genomes associated with 1 floodplain (one site), and genomes associated with two floodplains (two sites). UMAP showing clustering of Hellinger-transformed genome abundances of c genomes in the core floodplain microbiome (n = 42; in teal) and genomes not in the core floodplain microbiome (n = 242; red), and d overlay of the coefficient of variation (ratio of standard deviation to the mean) of genome abundances across samples, and e overlay of genomes associated with individual, pairs, or all floodplains based on an Indicator Species Analysis (ISA). Genomes that were present in 89 samples or more (teal) were not associated with any particular floodplain by ISA (group 7 in brown) and their abundance displayed a low coefficient of variation across samples. ISA genome associations: with floodplain G (1), with floodplain L (2), with floodplain Z (3), with both floodplain G and floodplain L (4), with both floodplain G and floodplain Z (5), with both floodplain L and floodplain Z (6), and not associated with any particular floodplain (7)
Fig. 4
Fig. 4
Proportion of representative genomes at the subspecies level with a given function among genomes detected in each sample within each floodplain. Box plots in each panel represent floodplain G (left), floodplain L (middle), and floodplain Z (right). a Most abundant functions: 1. Acetate formation, 2. Oxidation of CO and other small molecules, 3. Formate oxidation: CH2O2 to CO2 + H2, 4. Sulfide oxidation: H2S to S0. b Geochemical transformations in the Carbon cycle: 5. CO2 fixation pathways, 6. Anaerobic CO oxidation, 7. Methanol oxidation, 8. Formaldehyde oxidation pathways (see Table S4, Additional File 6). c Geochemical transformations in the sulfur cycle: 9. Sulfide oxidation (reverse dsr) from hydrogen sulfide: H2S to SO32-, 10. Sulfite oxidation to sulfate (or vice versa): SO32- to SO42-, 11. Thiosulfate oxidation without sulfur deposition: S2O32- to SO42-, 12. Thiosulfate oxidation with sulfur deposition: S2O32- to SO42- + S0. d The nitrogen cycle: 13. Nitrogen fixation: N2 to NH3, 14. Ammonia oxidation: NH3 to NH2OH, 15. Hydroxylamine oxidation (requires additional, undetermined enzyme): NH2OH to NO2-, 16. Nitrite oxidation: NO2- to NO3- (reversible), 17. Nitrate reduction (cytoplasmic): NO3- to NO2-, 18. Nitrate reduction (periplasmic): NO3- to NO2-, 19. Assimilatory nitrite reduction: NO2- to NH4, 20. Dissimilatory nitrite reduction: NO2- to NH4, 21. Assimilatory or dissimilatory nitrate reduction (ANRA or DNRA): 17 or 18 + 19 or 20, 22 & 23. Nitrite reduction (Denitrification): NO2- to NO, 24. Nitric oxide reduction: NO to N2O, 25. Nitrous oxide reduction: N2O to N2. e Hydrogen metabolism via hydrogenases: 26. FeFe hydrogenases group A (fermenting and bifurcating), 27. FeFe hydrogenases group C (H2 sensors), 28. NiFe hydrogenases group 1 (H2 oxidation), 29. NiFe hydrogenases group 2 (H2 oxidation), 30. NiFe hydrogenases group 3b (bidirectional), 31. NiFe hydrogenases group 3c (bidirectional), 32. NiFe hydrogenases group 3d (bidirectional). Paired, same color bars above boxplots indicate statistically significant differences between those two floodplains (two-way ANOVA)
Fig. 5
Fig. 5
Function abundance and its correlation with environmental variables. a Significant positive (green) or negative (violet) correlations between environmental variables (bottom) and biogeochemical transformations (left) identified by a fourth corner analysis. b Abundance of genomes encoding functions positively correlated with inorganic carbon concentrations (IC; %)
Fig. 6
Fig. 6
Analyses of transcription from samples collected in 2016 mapped to the genome set representative of the species level. a Transcription activity of genomes grouped by phylum or class based on total transcript read counts mapped to the representative genomes. Other bacteria: Candidatus Latescibacteria and Eisenbacteria-like bacteria. Phylogeny of the genomes at the species level was confirmed based on a concatenated ribosomal proteins tree (Data S2, Additional File 9). b Average transcription percentile for all genes encoding enzymes involved in a given biogeochemical transformation in each representative genome across all 2016 metatranscriptomes. c Differentially transcribed genes in response to soil OC. Statistically significant (DESeq2; q < 0.05) genes are colored by function, and not significant (n.s.) genes are in grey. d Differentially transcribed genes encoding CAZy in response to soil OC

References

    1. Viviroli D, Dürr HH, Messerli B, Meybeck M, Weingartner R. Mountains of the world, water towers for humanity: typology, mapping, and global significance. Water Resour Res. 2007;43(7). 10.1029/2006wr005653.
    1. Immerzeel WW, Lutz AF, Andrade M, Bahl A, Biemans H, Bolch T, Hyde S, Brumby S, Davies BJ, Elmore AC, Emmer A, Feng M, Fernández A, Haritashya U, Kargel JS, Koppes M, Kraaijenbrink PDA, Kulkarni AV, Mayewski PA, Nepal S, Pacheco P, Painter TH, Pellicciotti F, Rajaram H, Rupper S, Sinisalo A, Shrestha AB, Viviroli D, Wada Y, Xiao C, Yao T, Baillie JEM. Importance and vulnerability of the world’s water towers. Nature. 2020;577(7790):364–369. doi: 10.1038/s41586-019-1822-y. - DOI - PubMed
    1. Hubbard SS, Williams KH, Agarwal D, Banfield J, Beller H, Bouskill N, Brodie E, Carroll R, Dafflon B, Dwivedi D, Falco N, Faybishenko B, Maxwell R, Nico P, Steefel C, Steltzer H, Tokunaga T, Tran PA, Wainwright H, Varadharajan C. The East River, Colorado, watershed: a mountainous community testbed for improving predictive understanding of multiscale hydrological–biogeochemical dynamics. Vadose Zone J. 2018;17(1):180061. doi: 10.2136/vzj2018.03.0061. - DOI
    1. Levin SA. The problem of pattern and scale in ecology: the Robert H. MacArthur Award lecture. Ecology. 1992;73(6):1943–1967. doi: 10.2307/1941447. - DOI
    1. Diamond S, Andeer PF, Li Z, Crits-Christoph A, Burstein D, Anantharaman K, et al. Mediterranean grassland soil C–N compound turnover is dependent on rainfall and depth, and is mediated by genomically divergent microorganisms. Nat Microbiol. 2019, 4(8). 10.1038/s41564-019-0449-y. - PMC - PubMed

Publication types