. 2021 Jul;297(1):100813.
doi: 10.1016/j.jbc.2021.100813. Epub 2021 May 21.

Enrichment of NPC1-deficient cells with the lipid LBPA stimulates autophagy, improves lysosomal function, and reduces cholesterol storage

Affiliations

Enrichment of NPC1-deficient cells with the lipid LBPA stimulates autophagy, improves lysosomal function, and reduces cholesterol storage

Olga Ilnytska et al. J Biol Chem. 2021 Jul.

Abstract

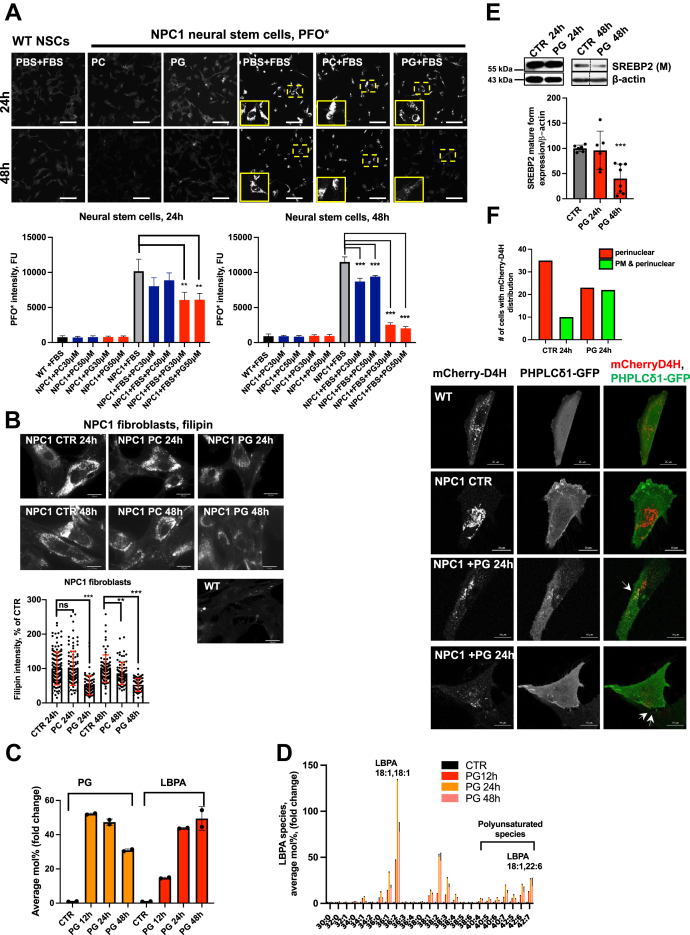
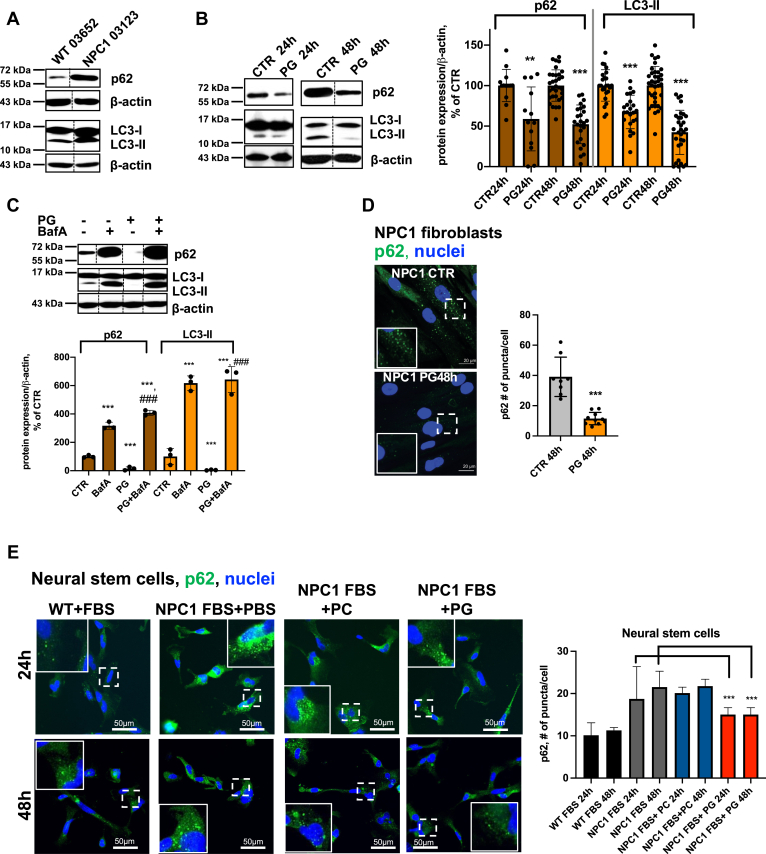
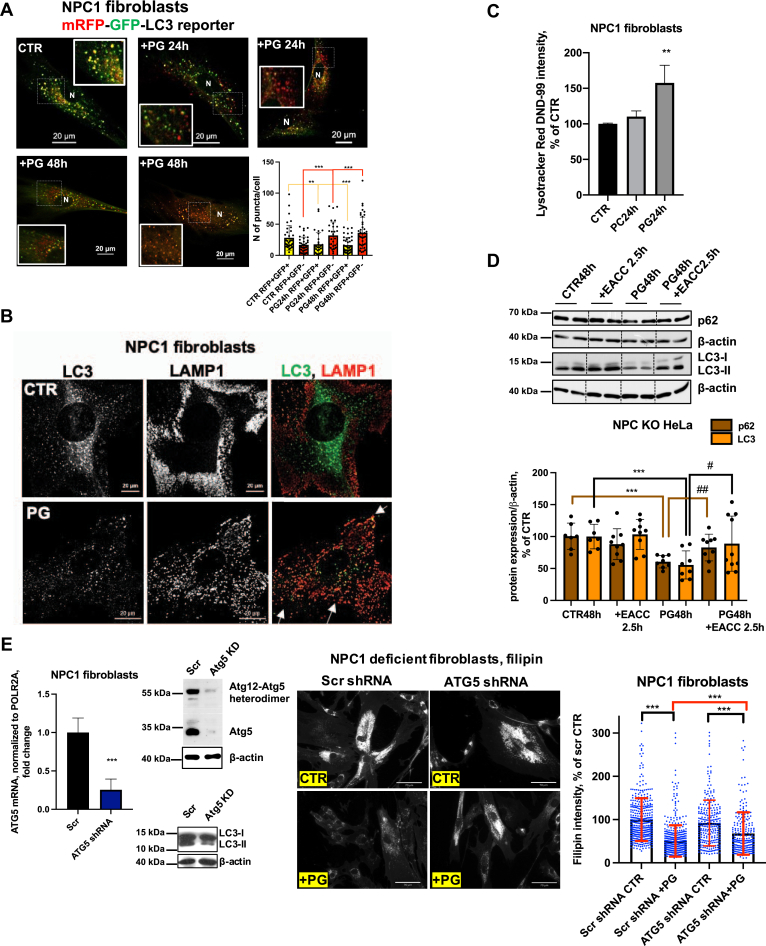
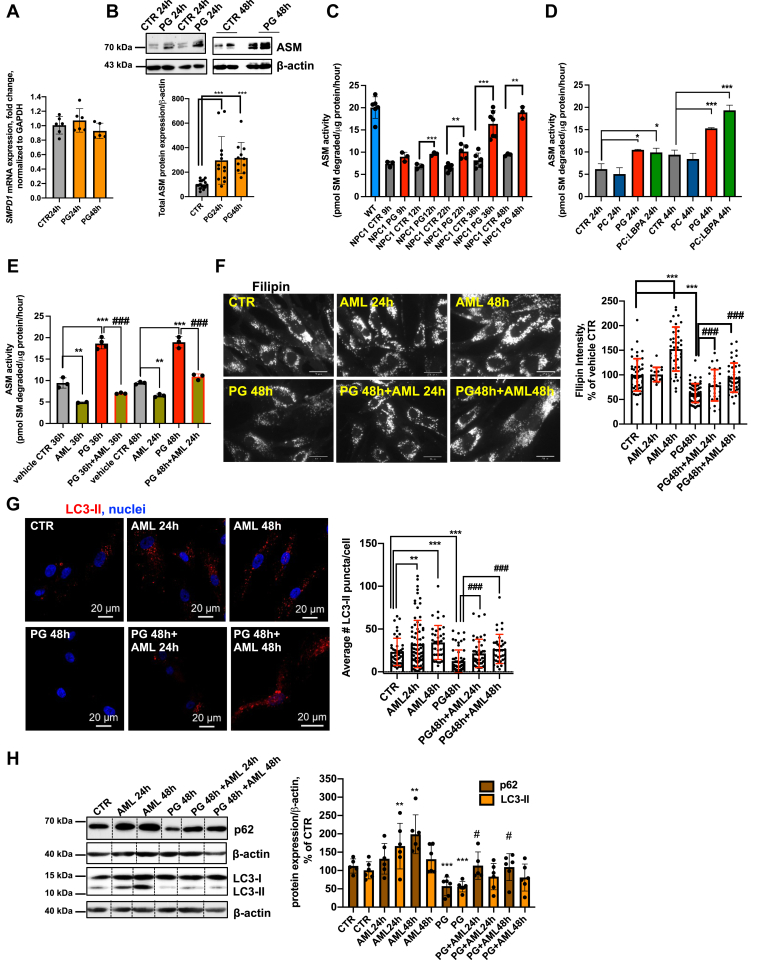
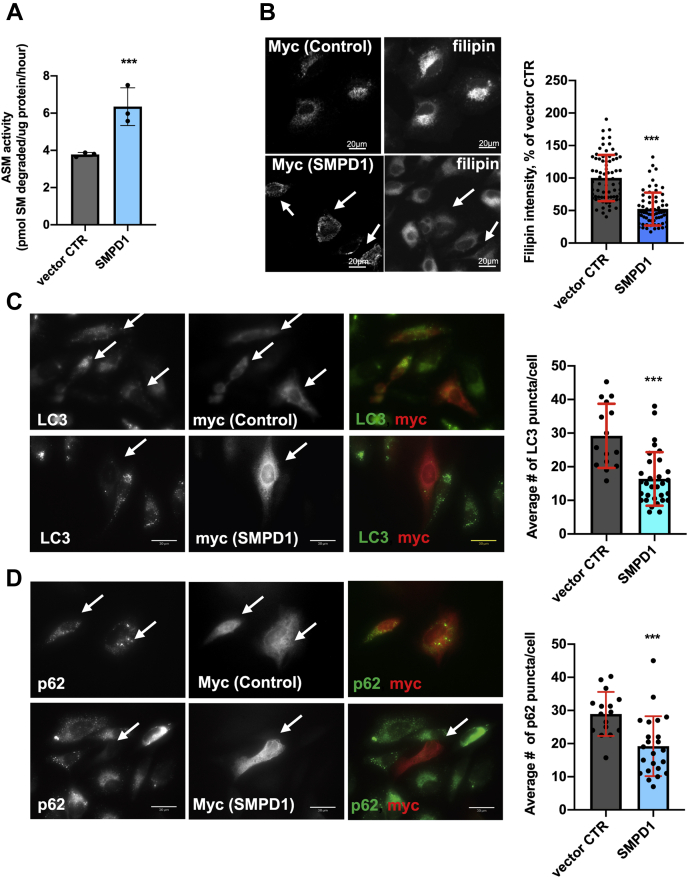
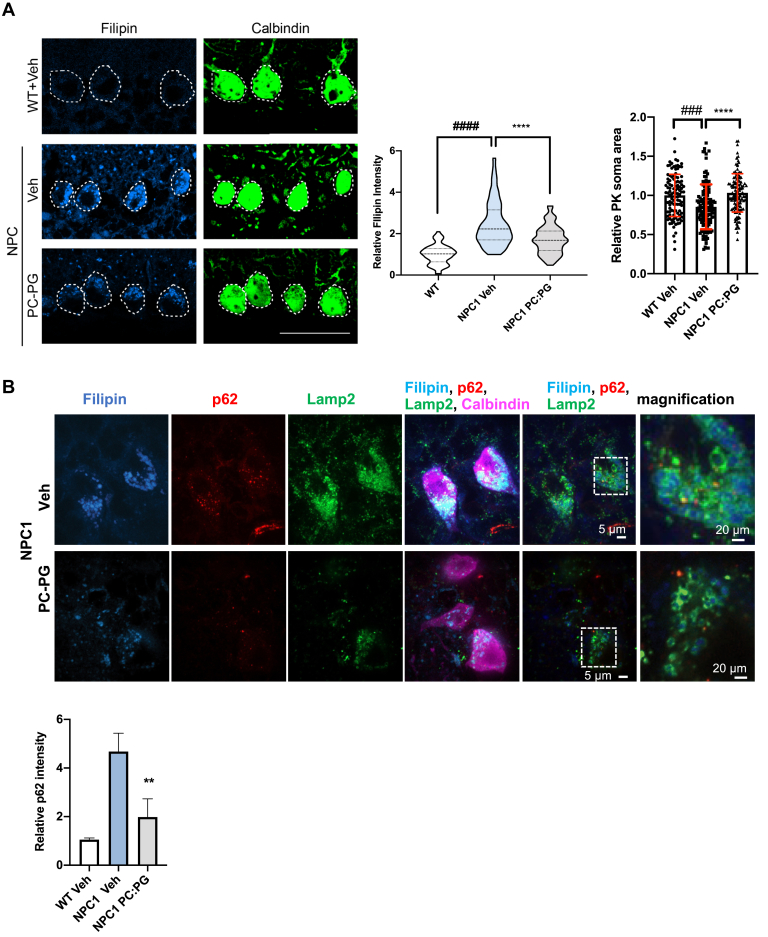
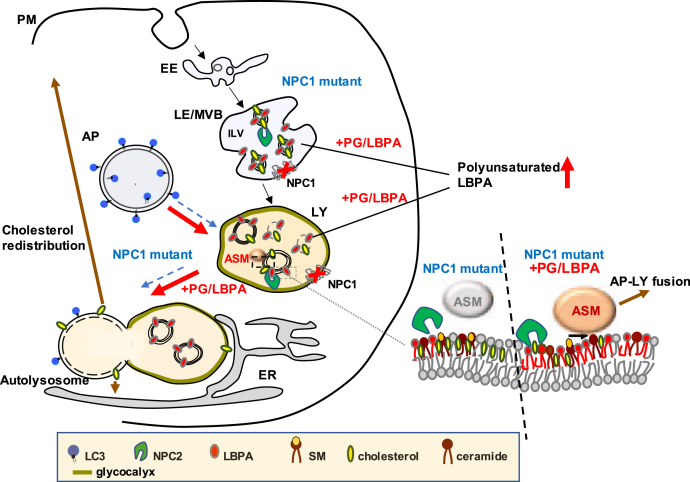
Niemann-Pick C (NPC) is an autosomal recessive disorder characterized by mutations in the NPC1 or NPC2 genes encoding endolysosomal lipid transport proteins, leading to cholesterol accumulation and autophagy dysfunction. We have previously shown that enrichment of NPC1-deficient cells with the anionic lipid lysobisphosphatidic acid (LBPA; also called bis(monoacylglycerol)phosphate) via treatment with its precursor phosphatidylglycerol (PG) results in a dramatic decrease in cholesterol storage. However, the mechanisms underlying this reduction are unknown. In the present study, we showed using biochemical and imaging approaches in both NPC1-deficient cellular models and an NPC1 mouse model that PG incubation/LBPA enrichment significantly improved the compromised autophagic flux associated with NPC1 disease, providing a route for NPC1-independent endolysosomal cholesterol mobilization. PG/LBPA enrichment specifically enhanced the late stages of autophagy, and effects were mediated by activation of the lysosomal enzyme acid sphingomyelinase. PG incubation also led to robust and specific increases in LBPA species with polyunsaturated acyl chains, potentially increasing the propensity for membrane fusion events, which are critical for late-stage autophagy progression. Finally, we demonstrated that PG/LBPA treatment efficiently cleared cholesterol and toxic protein aggregates in Purkinje neurons of the NPC1I1061T mouse model. Collectively, these findings provide a mechanistic basis supporting cellular LBPA as a potential new target for therapeutic intervention in NPC disease.

Keywords: Niemann–Pick type C disease; acid sphingomyelinase; autophagy; cholesterol; lysobisphosphatidic acid.


Conflict of interest statement

Conflict of interest The authors declare that they have no conflicts of interest with the contents of this article.

Figures

Figure 1
Figure 1
PG treatment in NPC1 cellular models raises LBPA levels and restores cholesterol homeostasis.A, representative PFO∗ images of differentiated WT (GM05659) and NPC1 (GM03123) fibroblasts to neural stem cells (NSC) and treated with 30 or 50 μM of PC and PG for 24 and 48 h in the absence and presence of 2.5% FBS to induce cholesterol accumulation. Bar graph represents quantification of PFO∗ intensity. Scale bar, 50 μm. N = 200 to 600 cells/condition. B, representative epifluorescent images and quantification of filipin intensity in WT or NPC1 mutant human fibroblasts treated with 100 μM PG or PC for 24 and 48 h. Scale bar, 30 μm. Dots represent fluorescent intensities of single cells. Data from three independent experiments. N = 78 to 125 cells/condition. C, LC-MS analysis of total PG and LBPA levels in NPC1-mutant fibroblasts treated with 100 μM PG for 12, 24, and 48 h. N = 2. See also Fig. S1, CE. D, LC-MS analysis of molecular species of LBPA in NPC1-deficient fibroblasts treated with 100 μM PG for 12, 24, and 48 h relative to untreated control. E, Western blot analysis of expression of mature form of SREBP2 at 24 and 48 h of PG treatment in NPC1-mutant fibroblasts. On the right panel samples were analyzed in biological replicates. For each condition one band was cropped and bands for CTR and PG were spliced. Splicing is indicated with a vertical line. PG concentration 100 μM. Data from three independent experiments. N = 6 to 8. F, mCherry-D4H cholesterol reporter distribution in live NPC1 mutant fibroblasts treated with 100 μM PG or vehicle control for 24 h. Total N = 40 cells/group expressing reporter were imaged using an epifluorescent microscope and analyzed for reporter distribution pattern. Representative confocal images of WT and NPC1 mutant fibroblasts coexpressing mCherry-D4H and PH-PLCδ1-GFP show partial colocalization of reporters in PG-treated cells. Scale bar, 20 μm. All graphed data show mean ± SD. ∗∗p < 0.01, ∗∗∗p < 0.001 compared with untreated cells (CTR) in two-tailed t test. FBS, fetal bovine serum; LBPA, lysobisphosphatidic acid; NPC1, Niemann–Pick type C1; PC, phosphatidylcholine; PG, phosphatidylglycerol.
Figure 2
Figure 2
PG/LBPA enrichment increases autophagic clearance in NPC1-deficient fibroblasts. A, Western blot analysis of LC3-II and p62 in WT and NPC1 fibroblasts. B, Western blot analysis and quantification of LC3-II and p62 in NPC1 fibroblasts treated with 100 μM PG for 24 and 48 h relative to untreated CTR. Data from 6 to 8 independent experiments. C, Western blot analysis shows inhibition of LC3-II and p62 clearance by BafA1. Cells were treated with 100 μM PG for 48 h, and BafA1 (100 nM) was added for the last 24 h. In AC (images) all conditions were analyzed in biological replicates. For each condition one band was cropped and bands for all conditions were spliced. Splicing is indicated with a vertical line. D, confocal images and quantification of p62-positive puncta in NPC1 fibroblasts at 48 h. Scale bar, 20 μm. Individual dots represent average # per cell/image. Average cell N in image is 2 to 6 cells. E, fluorescent staining and quantification of p62- positive puncta in WT and NPC1-deficient neural stem cells. Scale bar, 50 μm. N ≥ 2000 cells/condition. PG 50 μM. All graphed data show mean ± SD. ∗∗p < 0.01, ∗∗∗p < 0.001 compared with untreated cells (CTR), ###p < 0.001 compared with PG treated in two-tailed t test. NPC1, Niemann–Pick type C1; PG, phosphatidylglycerol.
Figure 3
Figure 3
PG/lysobisphosphatidic acid enrichment increases the formation of autolysosomes, reduces lysosomal clustering, improves lysosomal mobility, and induces cholesterol efflux in autophagy-dependent manner.A, PG treatment for 24 h improves the impaired autophagic flux by facilitating formation of autolysosomes (red puncta) and reducing the number of autophagosomes (yellow puncta). Representative confocal images and image quantification from four independent experiments. N ≥ 30 cells/condition. B, confocal images of LAMP1 and LC3 in NPC1 fibroblasts treated with 100 μM PG for 48 h. Scale bar, 20 μm. Arrows indicate redistribution and colocalization of LC3 and LAMP1 in PG-treated cells. C, flow cytometry analysis of Lysotracker Red DND-99 intensity. N = 3 biological replicates/condition, each sample contained 4000 cells. D, Western blot analysis of p62 and LC3-II expression in NPC1 KO HeLa cells treated with PG for 48 h, PG for 46.5 h+ EACC for 2.5 h (10 μM), EACC alone for the last 2.5 h of the experiment. On the upper panel all conditions were analyzed in biological triplicates. For each condition two bands were cropped and bands for all conditions were spliced. Splicing is indicated with a vertical line. Data from three independent experiments. E, mRNA expression and Western blot analysis of Atg5 and Atg12-Atg5 heterodimer expression, LC3 expression, filipin staining and quantification of filipin intensity in NPC1-deficient fibroblasts stably transduced with lentiviral nonsilencing (Scr) or Atg5 shRNA and selected for stable shRNA expression. N ≥ 220 cells/condition. Data from two independent experiments. Scale bar, 70 μm All graphed data show mean ± SD. ∗∗p < 0.01, ∗∗∗p < 0.001 compared with untreated cells (CTR, Scr), #p < 0.05, ##p < 0.01 compared with PG in two-tailed t test. NPC1, Niemann–Pick type C1; PG, phosphatidylglycerol.
Figure 4
Figure 4
ASM regulation of cholesterol clearance and autophagic flux in PG-treated NPC1-deficient fibroblasts.A, time course of mRNA expression of SMPD1 in PG-treated NPC1-deficient fibroblasts. (PG-100 μM). B, time course of ASM protein expression in PG-treated NPC1-deficient fibroblasts (PG-100 μM). C, ASM activity in WT and NPC1-deficient fibroblasts, treated with PG (100 μM) for 9 to 48 h. D, ASM activity in NPC1 fibroblasts treated with PG (100 μM), PC (100 μM), and PC:LBPA (1:1 mol:mol) (100 μM:100 μM) for 44 h. E, the ASM inhibitor amitriptyline (AML) (5 μM) significantly inhibits ASM activity. F, AML, 5 μM, increases cholesterol levels in control NPC1 fibroblasts and diminishes the cholesterol clearance in PG-treated cells. Cells were treated with AML alone for 24 or 48 h, PG alone for 48 h, or PG for 48 h with AML for 24 or 48 h. Data from three independent experiments. Representative epifluorescent images of NPC1-deficient cells. Scale bar, 30 μm. N ≥ 80 cells/condition. G, AML increases accumulation of LC3-II in untreated NPC1 cells and diminishes the stimulatory effect of PG on LC3-II degradation in treated cells. Cells were treated with AML as in F. Data from two independent experiments. Representative confocal images. Scale bar, 20um. N ≥ 80 cells/condition. H, Western blot analysis of p62 and LC3-II in NPC1 fibroblasts treated with PG, AML alone, or PG+AML as in F and E. On the upper panel all conditions were analyzed in biological replicates. For each condition one band was cropped and bands for all conditions were spliced. Splicing is indicated with a vertical line. All graphed data show mean ± SD. ∗p < 0.05, ∗∗p < 0.01, ∗∗∗p < 0.001 compared with control, #p < 0.05, ###p < 0.001 compared with PG in two-tailed Student’s test. ASM, acid sphingomyelinase; NPC1, Niemann–Pick type C1; PG, phosphatidylglycerol.
Figure 5
Figure 5
ASM overexpression reduces cholesterol accumulation and increases autophagic flux in NPC1 KO HeLa cells.A, ASM activity in HeLa NPC1 KO cells transfected with empty vector (myc-tag) or SMPD1-myc at 24 h post transfection. B, representative confocal images and filipin intensity quantification in empty vector or SMPD1-transfected HeLa NPC1 KO cells at 24 h post transfection. N ≥ 70 cells/condition. C, representative epifluorescent images and quantification of number of LC3 puncta in NPC1 KO cells expressing vector CTR or SMPD1 at 24 h post transfection. N ≥ 55 cells/condition. D, representative epifluorescent images and quantification of p62 puncta in NPC1 KO cells expressing vector CTR or SMPD1 at 24 h post transfection. N ≥ 35 cells/condition. All graphed data show mean ± SD. ∗∗∗p < 0.001 versus vector control in two-tailed Student’s test. In all images, arrows indicate vector control myc-tag or SMPD1-myc tag-expressing cells. ASM, acid sphingomyelinase; NPC1, Niemann–Pick type C1.
Figure 6
Figure 6
PG treatment results in cholesterol and p62 clearance in Purkinje neurons of NPC1 (I1061T/I1061T) mice.A, cholesterol levels (filipin) and soma size in Purkinje neurons (calbindin) of WT and NPC1 (I1061T/I1061T) mice at 1 week post intracerebroventricular injections of PBS (Veh) or 800 μM PC:PG (1:1 mol:mol; 400 μM PC + 400 μM PG). Violin plot shows median (dashed line), 25% and 75% (dotted lines), and probability density (thickness). Dashed lines indicate Purkinje cell soma. Scale bar, 50 μm. Data are mean ± SD from n = 5 mice per treatment group, and cell numbers: WT+Veh = 110, NPC+Veh = 112, NPC+PC:PG = 122 cells. ∗∗∗∗p ≤ 0.0001: NPC1 vehicle treated compared with PC:PG treated, ###p ≤ 0.001, ####p ≤ 0.0001: NPC1 vehicle treated versus WT. One-way ANOVA with Tukey post hoc test (F, 101.9 df = (2)). B, p62 costaining with filipin, calbindin, LAMP2, and p62 quantification in calbindin-positive neurons of WT+Veh-, NPC1+Veh-, and NPC1+PC:PG-treated mice. ∗∗p ≤ 0.01. Scale bar, 5 μm. See also Fig. S4. NPC1, Niemann–Pick type C1; PC, phosphatidylcholine; PG, phosphatidylglycerol.
Figure 7
Figure 7
Proposed mechanism of action of PG/LBPA enrichment in stimulating autophagy in NPC1 mutant cells. Untreated NPC1-deficient (NPC mutant) cells with elevated cholesterol levels in the LE (MVB)/LY have impaired AP-LY fusion, reduced ASM activity, enlarged AP and LY, and insufficient LBPA. Dashed blue arrows indicate processes impaired in NPC1-deficient cells. In the presence of functional NPC2, PG/LBPA enrichment of NPC1 mutant cells leads to cholesterol clearance from the LE/LY. PG/LBPA enrichment activates ASM, which mediates enhancement of AP-LY fusion to form autolysosomes, and enhances autophagic flux (red arrows). Enhanced AP-LY fusion would provide an exit route for cholesterol out of the LE/LY that can more easily bypass the LY glycocalyx and access the membrane bilayer with consequent intracellular redistribution of cholesterol to the PM and/or to the ER and other organelles (brown arrow, proposed). AP, autophagosome; ASM, acid sphingomyelinase; ER, endoplasmic reticulum; LBPA, lysobisphosphatidic acid; LE, late endosome; LY, lysosome; MVB, multivesicular body; NPC1, Niemann–Pick type C1; PC, phosphatidylcholine; PG, phosphatidylglycerol; PM, plasma membrane.

Similar articles

Cited by

References

    1. Carstea E.D., Morris J.A., Coleman K.G., Loftus S.K., Zhang D., Cummings C., Gu J., Rosenfeld M.A., Pavan W.J., Krizman D.B., Nagle J., Polymeropoulos M.H., Sturley S.L., Ioannou Y.A., Higgins M.E. Niemann-Pick C1 disease gene: Homology to mediators of cholesterol homeostasis. Science. 1997;277:228–231. - PubMed
    1. Naureckiene S., Sleat D.E., Lackland H., Fensom A., Vanier M.T., Wattiaux R., Jadot M., Lobel P. Identification of HE1 as the second gene of Niemann-Pick C disease. Science. 2000;290:2298–2301. - PubMed
    1. Vanier M.T. Complex lipid trafficking in Niemann-Pick disease type C. J. Inherit. Metab. Dis. 2015;38:187–199. - PubMed
    1. Pfrieger F.W., Vitale N. Cholesterol and the journey of extracellular vesicles. J. Lipid Res. 2018;59:2255–2261. - PMC - PubMed
    1. Mobius W., van Donselaar E., Ohno-Iwashita Y., Shimada Y., Heijnen H.F., Slot J.W., Geuze H.J. Recycling compartments and the internal vesicles of multivesicular bodies harbor most of the cholesterol found in the endocytic pathway. Traffic. 2003;4:222–231. - PubMed

Publication types

MeSH terms