. 2021 May 22;12(6):528.
doi: 10.1038/s41419-021-03820-7.

Upregulated PPARG2 facilitates interaction with demethylated AKAP12 gene promoter and suppresses proliferation in prostate cancer

Affiliations

Upregulated PPARG2 facilitates interaction with demethylated AKAP12 gene promoter and suppresses proliferation in prostate cancer

Feng Li et al. Cell Death Dis. .

Abstract

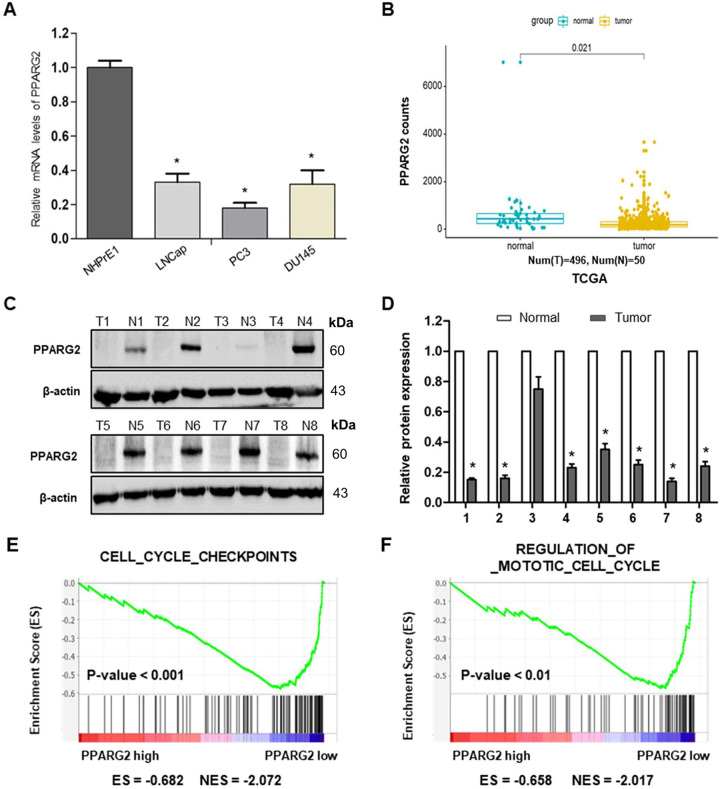
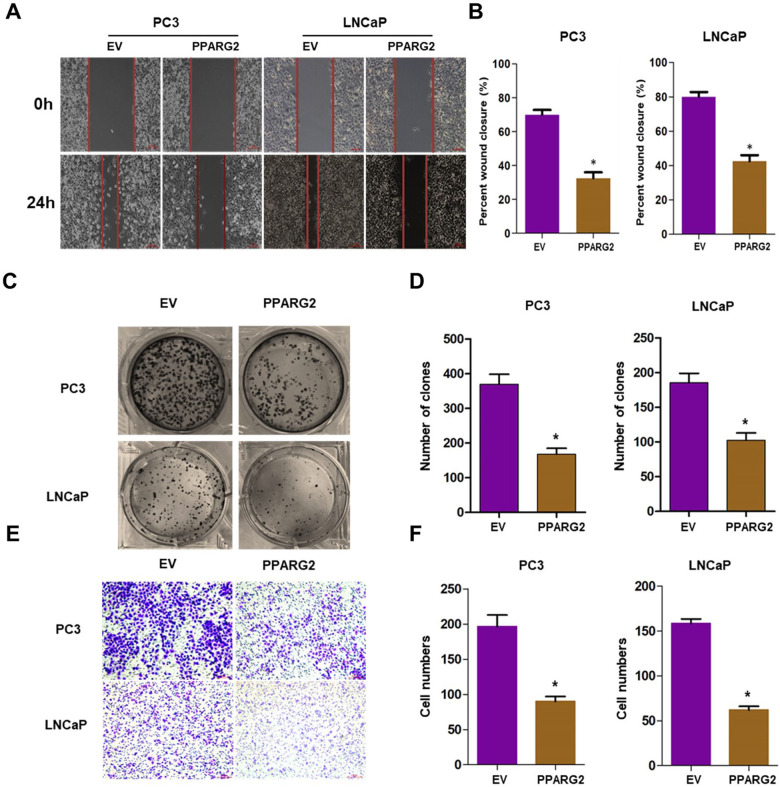
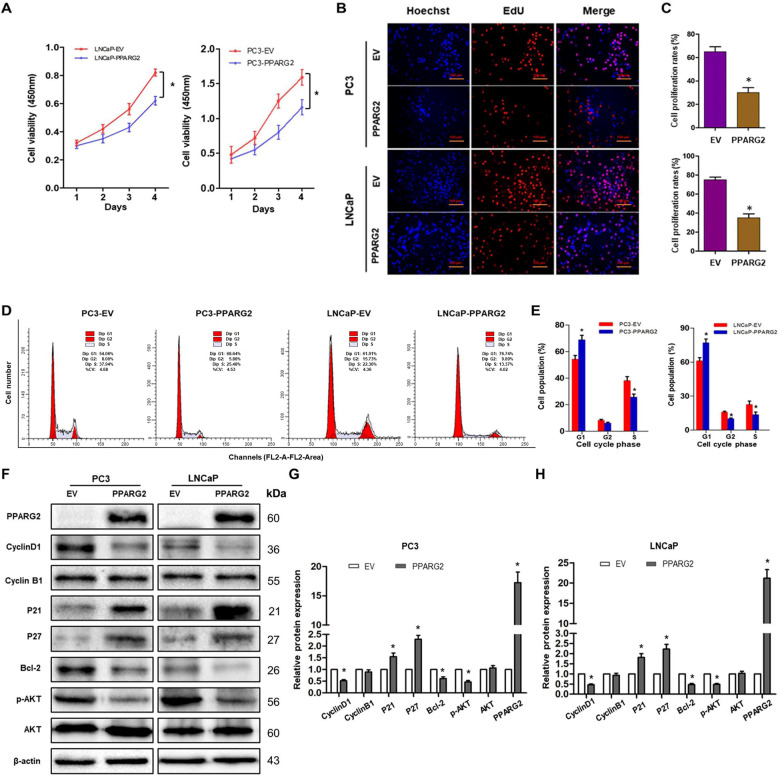
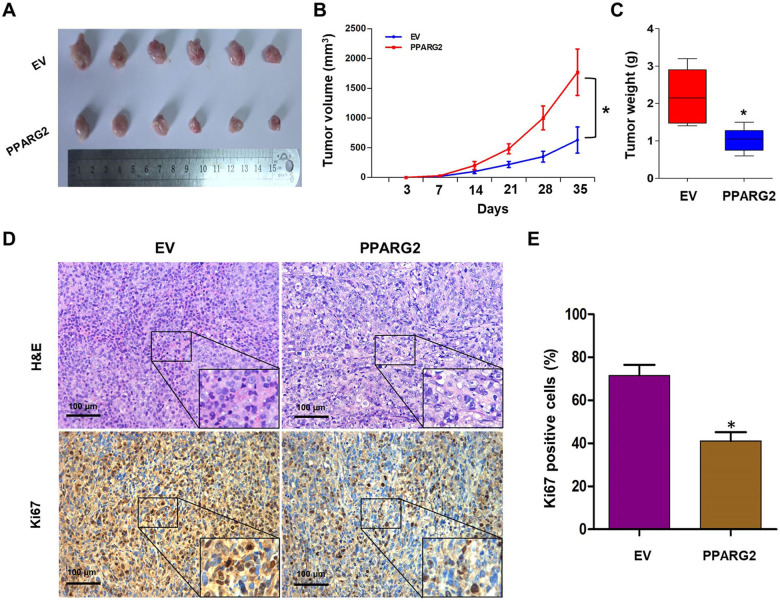
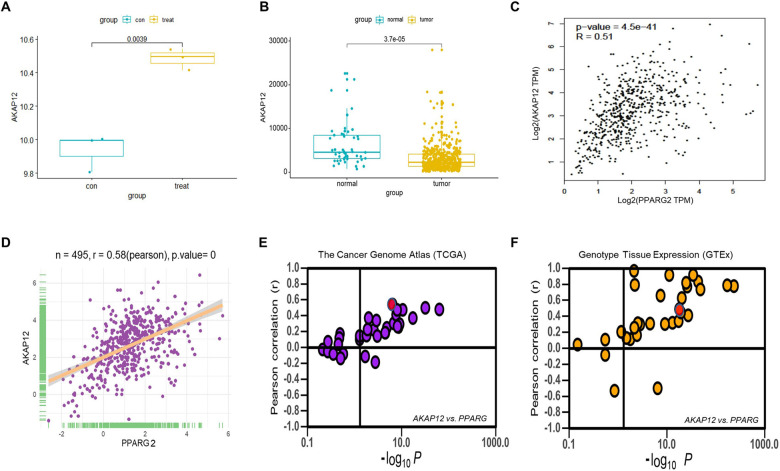
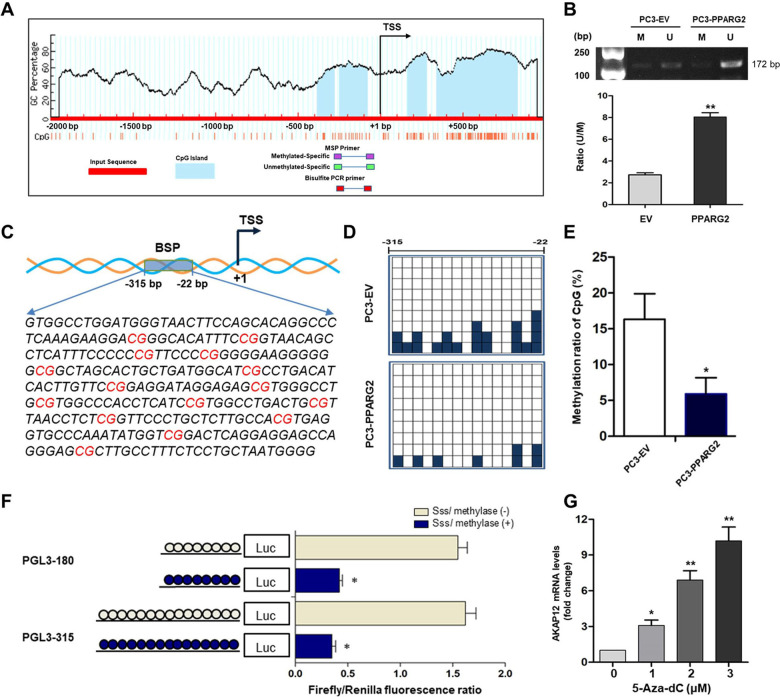
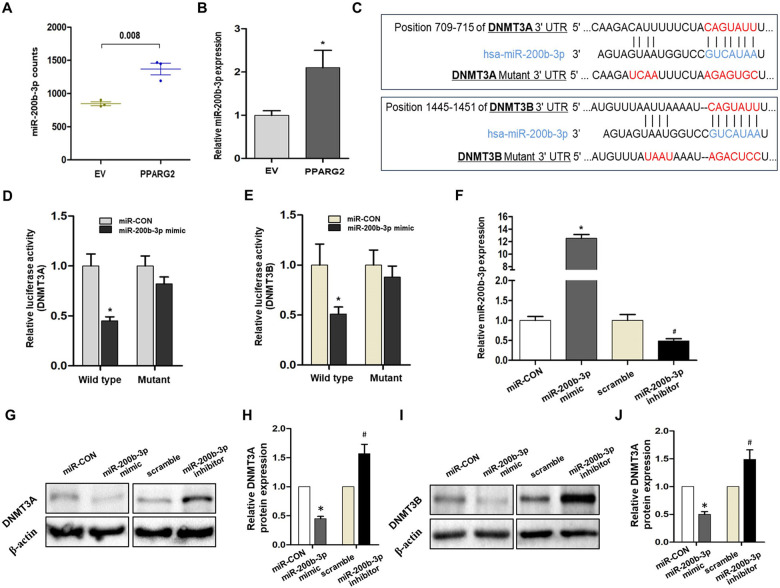
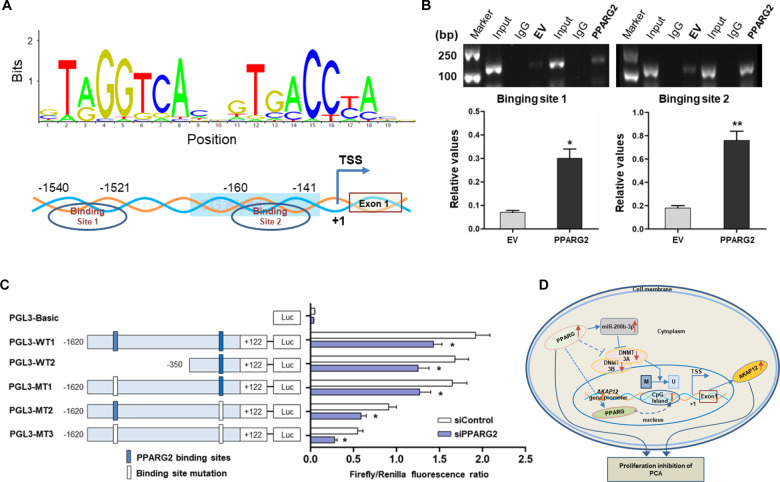
Prostate cancer (PCA) is one of the most common male genitourinary tumors. However, the molecular mechanisms involved in the occurrence and progression of PCA have not been fully clarified. The present study aimed to investigate the biological function and molecular mechanism of the nuclear receptor peroxisome proliferator-activated receptor gamma 2 (PPARG2) in PCA. Our results revealed that PPARG2 was downregulated in PCA, and overexpression of PPARG2 inhibited cell migration, colony formation, invasion and induced cell cycle arrest of PCA cells in vitro. In addition, PPARG2 overexpression modulated the activation of the Akt signaling pathway, as well as inhibited tumor growth in vivo. Moreover, mechanistic analysis revealed that PPARG2 overexpression induced increased expression level of miR-200b-3p, which targeted 3' UTR of the downstream targets DNMT3A/3B, and facilitated interaction with demethylated AKAP12 gene promoter and suppressed cell proliferation in PCA. Our findings provided the first evidence for a novel PPARG2-AKAP12 axis mediated epigenetic regulatory network. The study identified a molecular mechanism involving an epigenetic modification that could be possibly targeted as an antitumoral strategy against prostate cancer.


Conflict of interest statement

The authors declare no competing interests.

Figures

Fig. 1
Fig. 1. PPARG2 is downregulated in PCA, negatively correlated with cell cycle-activated gene signatures.
A Relative mRNA expression levels were analyzed in different PCA cell lines and a normal prostate epithelial progenitor cell line NHPrE1 by qRT-PCR. *P < 0.05 vs. normal group. B Expression of PPARG2 in 496 PCA tissues (tumor) compared with 50 normal tissues (normal) in the TCGA profile. P = 0.021. C, D Western blotting analyses of relative PPARG2 protein expression in eight PCA tissues (T) and eight prostate hyperplasia tissues (N). *P < 0.05 vs. normal group. E, F GSEA plot showing the PPARG2 expression level correlated negatively with cell cycle-activated gene signatures (CELL_CYCLE_CHECKPOINTS, REGULATION_OF_MITOTIC_CELL_CYCLE).
Fig. 2
Fig. 2. PPARG2 suppresses cell migration, colony formation, and invasion in vitro.
A, B Wound-healing assays were performed to detected the effects of PPARG2 on the proliferation of the PCA cells. *P < 0.05 vs. EV group. C, D Colony formation assays were performed in EV and PPARG2-transfected PCA cells. *P < 0.05 vs. EV group. E, F Representative images of invasion PCA cells transfected with EV or PPARG2 overexpression lentivirus vectors by Transwell cell invasion tests.
Fig. 3
Fig. 3. PPARG2 suppresses cell proliferation and induces cell cycle arrest of PCA cells in vitro.
A CCK-8 assay of the proliferation rates of recombinant PCA cell lines transfected with EV- and PPARG2-overexpression lentivirus vectors, respectively. *P < 0.01. B, C EDU assays were performed in EV and PPARG2-transfected PCA cells. *P < 0.05 vs. EV group. D, E Cell cycle profiles were examined by flow cytometry with propidium iodide (PI) staining; cell numbers were counted according to DNA content of G1, S, and G2 phases. *P < 0.05 vs. EV group. FH Western blot analysis of cyclinD1, cyclinB1, p21Cip1 and p27Kip1, Bcl-2, p-AKT, and AKT protein expressions in indicated cells. *P < 0.05 vs. EV group.
Fig. 4
Fig. 4. PPARG2 inhibits PCA cell proliferation in vivo.
AC Representative xenograft tumors in nude mice that were injected PC3 cells subcutaneously with overexpression of transfected PPARG2 or vector cells, respectively. Tumor volumes were calculated. Tumor weights were compared between EV and PPARG2 group. *P < 0.05 vs. EV group. D, E H&E staining and Ki67 expression level of subcutaneous tumors with IHC between EV and the PPARG2 group (×100). The representative images are from the same tumor samples. *P < 0.05 vs. EV group.
Fig. 5
Fig. 5. Positive correlation of AKAP12 in mRNA expression with PPARG2 gene in most cancer or normal tissues.
A AKAP12 mRNA expression extracted from the microarray data (EV (con) = 3, PPARG2 (treat) = 3, P = 0.0039). B AKAP12 mRNA expression in PCA patients extracted from TCGA database (normal = 50, tumor = 496, P < 0.001). C, D Correlation of AKAP12 with PPARG2 in expression from GEPIA database (r = 0.51, P < 0.001) and TCGA database (r = 0.58, P = 0). E, F Correlation of AKAP12 with PPARG2 in expression in cancer samples from The Cancer Genome Atlas (TCGA database) and normal tissues from Genotype Tissue Expression (GTEx database), respectively. It is noteworthy that every dot represents one cancer type (E) in which the red dot represents PCA tissues (r = 0.58, P < 0.001) or one tissue type (F) in which the red dot represents prostate tissues (r = 0.57, P < 0.001).
Fig. 6
Fig. 6. Upregulated PPARG2 induces demethylation of the AKAP12 promoter region in vitro.
A Scheme for the location of the CpG islands near the TSS in AKAP12 gene. The CpG sites were indicated by vertical red lines. The regions for MS-PCR and BSP were indicated. TSS, translation start site. B Representative results of methylation analysis by MS-PCR in PC3 cell line transfected with EV or PPARG2 plasmid. M, methylation; U, unmethylation. **P < 0.01 vs. EV group. C Schematic region from −315 to −22 bp for BSP including 15 CpG sites in the AKAP12 gene promoter area. D BSP analysis of methylation status of the AKAP12 gene promoter. It is noteworthy that each small square indicates one clone. A total of nine clones were subjected to bisulfite sequencing. The methylated clones of individual CpG sites are labeled in dark blue. E The methylated clone ratio at −315 to −22 bp region of CpG sites. *P < 0.05 vs. EV group. F Two luciferase constructs treated with SssI methylase in vitro. *P < 0.05 vs. SssI methylase (−) group. G RT-qPCR analysis of relative AKAP12 mRNA expression in PC3 cell line treated with 5-Aza-dc at different concentrations. *P < 0.05, **P < 0.01 vs. group of 0 µM (5-Aza-dc).
Fig. 7
Fig. 7. Experimental verification of the relationship between DNMT3A/3B and miR-200b-3p.
A miR-200b-3p expression extracted from miRNA-seq results (n = 3, P = 0.008). B Relative miR-200b-3p expression in vitro when overexpression of PPARG2. *P < 0.05 vs. EV group. C Putative miR-200b-3p-binding 3′-UTR sequence of DNMT3A/3B mRNA. Mutation was generated on the DNMT3A/3B mRNA 3′-UTR sequence in the complementary site for the seed region of miR-200b-3p. The wild-type or mutant miR-200b-3p-binding DNMT3A/3B mRNA 3′-UTR sequence was cloned into pmiR luciferase reporter. D The wild-type (DNMT3A/3′-UTR-WT) and mutant (DNMT3A/3′-UTR-Mut) pmiR luciferase reporter were co-transfected into PC3 cells with miR-CON and miR-200b-3p. *P < 0.05 vs. miR-CON group. E The wild-type (DNMT3B/3′-UTR-WT) and mutant (DNMT3B/3′-UTR-Mut) pmiR luciferase reporter were co-transfected into PC3 cells with miR-CON and miR-200b-3p. *P < 0.05 vs. miR-CON group. F Relative miR-200b-3p expression in vitro transfected with miR-200b-3p mimic or miR-200b-3p inhibitor by RT-qPCR. U6 was used as an internal control. *P < 0.05 vs. miR-CON group, #P < 0.05 vs. scramble group. G, H Analysis of DNMT3A protein expression by western blotting when transfected with miR-CON, miR-200b-3p mimic, scramble, or miR-200b-3p inhibitor into PC3 cells. β-Actin was used as an internal control. *P < 0.05 vs. miR-CON group, #P < 0.05 vs. scramble group. I, J Analysis of DNMT3B protein expression by western blotting when transfected with miR-CON, miR-200b-3p mimic, scramble, or miR-200b-3p inhibitor into PC3 cells. β-Actin was used as an internal control. *P < 0.05 vs. miR-CON group, #P < 0.05 vs. scramble group.
Fig. 8
Fig. 8. Enhanced binding of PPARG2 to AKAP12 promoter region due to DNA demethylation when PPARG2 is upregulated.
A Scheme for binding sequence and sites of PPARG2 binding to the transcription factor-binding site near the AKAP12 gene promoter region. TSS, transcription start site. B ChIP assay revealing the direct binding of PPARG2 to the AKAP12 gene promoter in PC3 cells between the EV and PPARG2 group. The enriched DNA fragments within the AKAP12 gene promoter using IgG and an anti-PPARG2 antibody were amplified by PCR. Total input was used as a positive control. *P < 0.05, **P < 0.01 vs. EV group. C Serially truncated and mutated AKAP12 gene promoter constructs were co-transfected with siPPARG2 or siControl into PC3 cells, and the relative luciferase activities were determined. *P < 0.05 vs. siControl group. D Proposed graphic model for PPARG2-AKAP12 axis-mediated epigenetic regulation mechanism of proliferation, migration, and invasion in PCA cells.

Similar articles

Cited by

References

    1. Siegel RL, Miller KD, Jemal A. Cancer statistics, 2018. CA Cancer J. Clin. 2018;68:7–30. doi: 10.3322/caac.21442. - DOI - PubMed
    1. Roth JA, Gulati R, Gore JL, Cooperberg MR, Etzioni R. Economic analysis of specific antigen screening and selective treatment strategies. JAMA Oncol. 2016;2:890–898. doi: 10.1001/jamaoncol.2015.6275. - DOI - PMC - PubMed
    1. Xu Y, et al. Family history is significantly associated with prostate cancer and its early onset in Chinese population. Prostate. 2019;79:1762–1766. doi: 10.1002/pros.23900. - DOI - PubMed
    1. Fenton JJ, et al. Prostate-specific antigen-based screening for prostate cancer: evidence report and systematic review for the US preventive services task force. JAMA. 2018;319:1914–1931. doi: 10.1001/jama.2018.3712. - DOI - PubMed
    1. Eldred-Evans D, et al. Rethinking prostate cancer screening: could MRI be an alternative screening test? Nat. Rev. Urol. 2020;17:526–539. doi: 10.1038/s41585-020-0356-2. - DOI - PubMed

Publication types

MeSH terms