. 2021 Jun 21;49(11):6181-6195.
doi: 10.1093/nar/gkab392.

The nuclear periphery is a scaffold for tissue-specific enhancers

Affiliations

The nuclear periphery is a scaffold for tissue-specific enhancers

Cheryl L Smith et al. Nucleic Acids Res. .

Abstract

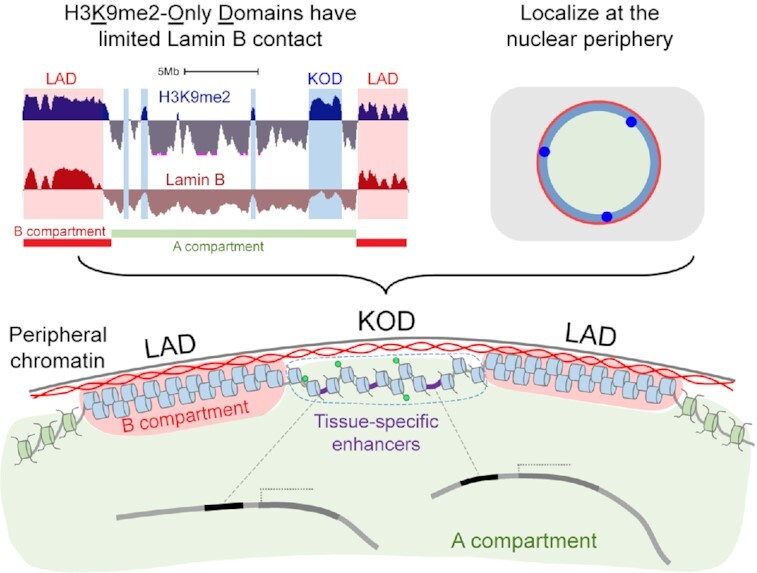
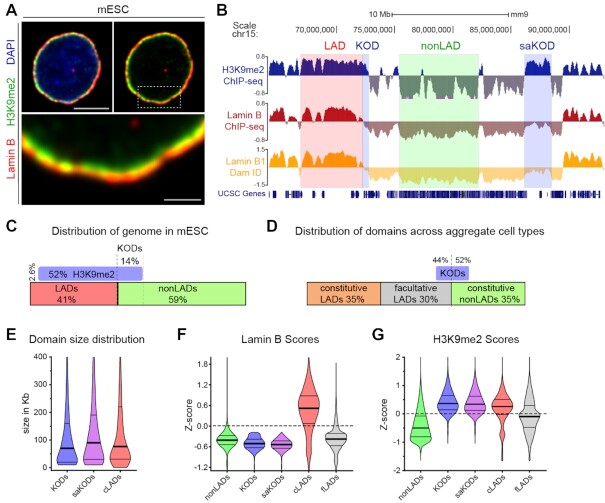
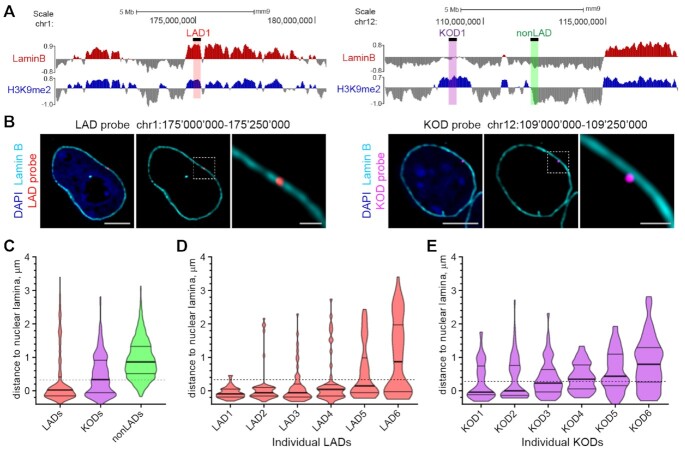
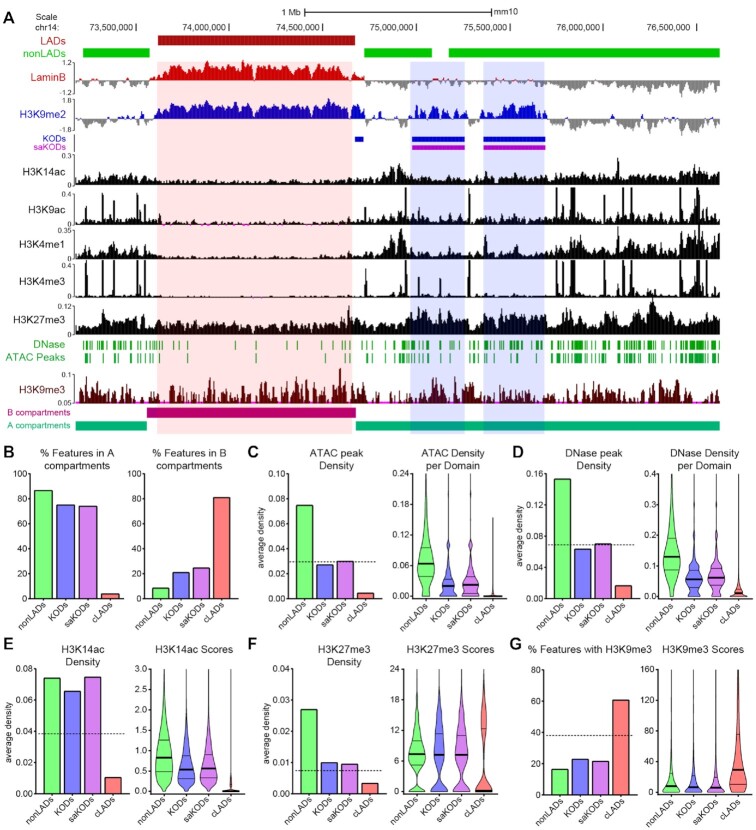
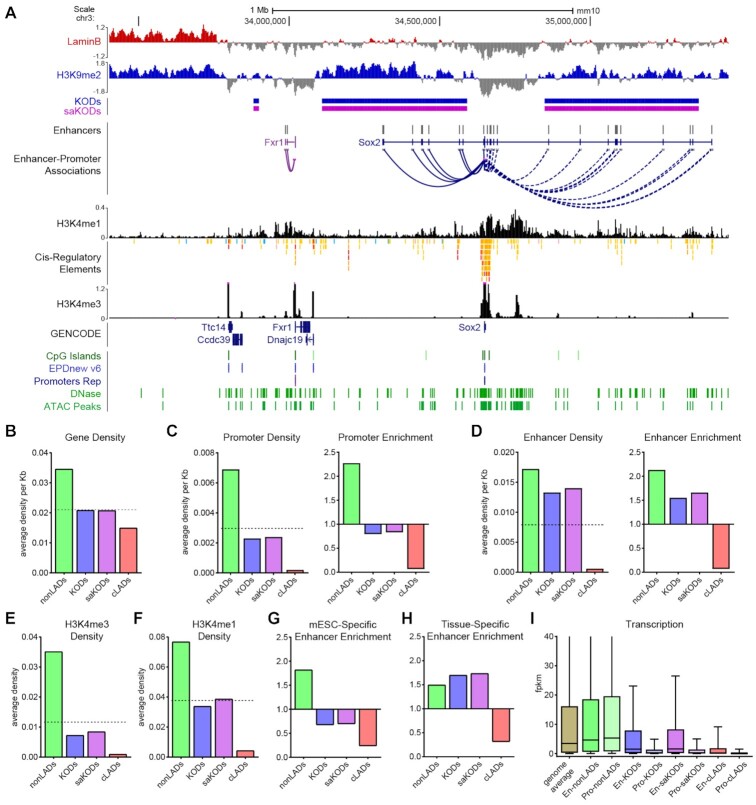
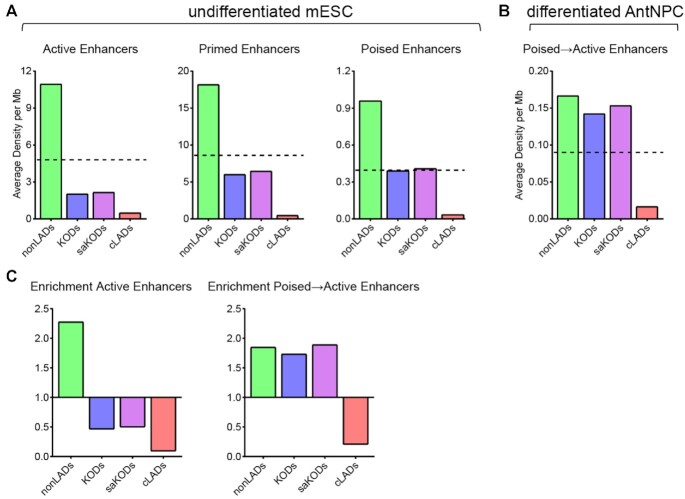
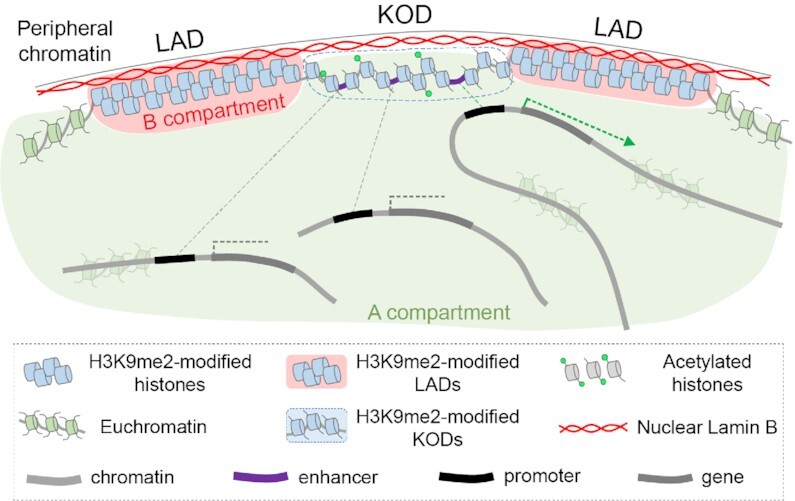
Nuclear architecture influences gene regulation and cell identity by controlling the three-dimensional organization of genes and their distal regulatory sequences, which may be far apart in linear space. The genome is functionally and spatially segregated in the eukaryotic nucleus with transcriptionally active regions in the nuclear interior separated from repressive regions, including those at the nuclear periphery. Here, we describe the identification of a novel type of nuclear peripheral chromatin domain that is enriched for tissue-specific transcriptional enhancers. Like other chromatin at the nuclear periphery, these regions are marked by H3K9me2. But unlike the nuclear peripheral Lamina-Associated Domains (LADs), these novel, enhancer-rich domains have limited Lamin B interaction. We therefore refer to them as H3K9me2-Only Domains (KODs). In mouse embryonic stem cells, KODs are found in Hi-C-defined A compartments and feature relatively accessible chromatin. KODs are characterized by low gene expression and enhancers located in these domains bear the histone marks of an inactive or poised state. These results indicate that KODs organize a subset of inactive, tissue-specific enhancers at the nuclear periphery. We hypothesize that KODs may play a role in facilitating and perhaps constraining the enhancer-promoter interactions underlying spatiotemporal regulation of gene expression programs in differentiation and development.


Figures

Graphical Abstract
Graphical Abstract
Histone H3K9me2-Only Domains (KODs) represent a subclass of peripheral chromatin with minimal nuclear lamina contact and enrichment for tissue-specific enhancers.
Figure 1.
Figure 1.
H3K9me2-Only Domains (KODs) mark nuclear peripheral chromatin with minimal Lamin B association. (A) Representative immunofluorescent confocal images of a mouse embryonic stem cell (mESC), counterstained with DAPI. Area in dotted box highlighted in bottom panel. Scale bars, 5 and 1 μm. (B) Representative genome tracks from mESCs for H3K9me2 ChIPseq, Lamin B ChIPseq (1), and Lamin B DamID (3). Examples of LADs (red), nonLADs (green), KODs and stand-alone KODs (saKODs, blue) are highlighted. (C) Genome coverage per domain type (expressed as percent of total genome) in mESCs. LADs, nonLADs, H3K9me2-modified chromatin, and KODs as defined by Lamin B and H3K9me2 ChIPseq in mESCs ((1); this study). (D) Genome coverage for constitutive LADs, facultative LADs, and constitutive nonLADs as defined by Lamin B1 DamID across aggregate cell types (19). Percentage of KOD basepairs overlapping nonLADs (52%), fLADs (44%), and cLADs (4%, not shown). (E) Distribution of domain sizes (in kb) for KODs (n = 2603, all KODs), saKODs (n = 1969, a subset of all KODs), and cLADs (n = 3877). (F, G) Distributions of average ChIPseq scores per domain for nonLADs, KODs, saKODs, cLADs, and fLADs in mESCs for Lamin B (F) and H3K9me2 (G). Lines on violin plots show median, 25% and 75% quartiles. Statistical analysis was performed using ANOVA Kruskal-Wallis test with Dunn's multiple comparisons and Mann–Whitney test; see Supplemental Table S2.
Figure 2.
Figure 2.
KODs are localized at the nuclear periphery. (A) Genomic locations of DNA oligo probes targeting a LAD (left panel; red highlight), a KOD (right panel; purple highlight) or a non-LAD (right panel; green highlight) shown with corresponding genome tracks (mm9) for H3K9me2 and Lamin B ChIPseq from mESCs. 250 kb regions targeted with DNA oligo probes shown as black bars above Lamin B tracks. (B) Localization of regions from a LAD and a KOD in interphase mESCs. Representative immuno-FISH images of cells hybridized with fluorescent DNA oligo probes targeting an individual LAD (red; left 3 panels) and an individual KOD (purple; right 3 panels), and immunostained for Lamin B (cyan) and DAPI (blue). Area in dotted boxes highlighted in right panel of each set. Scale bars: 5 and 1 μm. (C) Violin plots show distribution of distances to the nuclear periphery (as defined by Lamin B) of individual LAD, KOD, or nonLAD probes for ≥300 target loci. (D, E) Violin plots show distribution of distances to the nuclear periphery (as defined by Lamin B) for six individual (D) LADs or (E) KODs; n = 50 target loci in 25 cells. All KOD probes target saKODs. For C–E, dotted line indicates average thickness of H3K9me2 peripheral chromatin layer. Lines on violin plots show median, 25% and 75% quartiles. Statistical analysis was performed using ANOVA Kruskal-Wallis test with Dunn's multiple comparisons and Mann Whitney test; see Supplemental Table S2.
Figure 3.
Figure 3.
KODs mark regions of accessible chromatin. (A) UCSC genome browser view (mm10) showing LADs (red bars), nonLADs (green bars), KODs (blue bars), and saKODs (purple bars) with representative genome tracks for Lamin B ChIPseq, histone marks as indicated, DNase and ATAC peaks, and A/B compartments. All datasets from mESCs. An example LAD (red highlight) and 2 example KODs (blue highlights) are shown. (B) Percent of each domain type associated with A (left) or B (right) compartments. (C) ATAC peak density per kb plotted as a domain-wide average (left panel) or distribution of densities across all domains of each type (right panel). (D) DNase peak density per kb plotted as a domain-wide average (left panel) or distribution of densities across all domains of each type (right panel). (E, F) Density per kb plotted as domain-wide average (left panel) or distribution of scores (signal intensity) per domain for each type (right panel) for (E) H3K14ac and (F) H3K27me3 peaks. (G) Percent of each domain type with H3K9me3 enrichment (left panel) and distribution of H3K9me3 scores per domain for each type (right panel). Dotted lines in left panels of C-G indicate genome-wide average for each category plotted. Lines on violin plots show median, 25% and 75% quartiles. Statistical analysis was performed using ANOVA Kruskal-Wallis test with Dunn's multiple comparisons and Mann–Whitney test; see Supplemental Table S2.
Figure 4.
Figure 4.
KODs are enriched for transcriptional enhancers. (A) UCSC genome browser view (mm10) of the Sox2 locus with its associated enhancers, many of which are in KODs surrounding the Sox2 gene body (GENCODE Track). Displayed tracks are Lamin B ChIPseq, histone marks as indicated, DNase and ATAC peaks, and CpG islands (all datasets from mESCs). Enhancers and predicted Enhancer-Promoter associations based on ENCODE panel of 72 mouse tissue-stages (44). (B) Domain-wide average gene density per kb of each domain type. (C, D) Domain-wide average density per kb of each domain by type (left panel) and enrichment (fold change observed over expected for randomly permuted genomic regions of equal size) for each domain type (right panel) for promoters (C) and enhancers (D). (E, F) Domain-wide average density per kb of (E) H3K4me3 and (F) H3K4me1 peaks per domain type. (G) Enrichment of mESC-specific enhancers by domain type. (H) Enrichment of all tissue-specific enhancers (not including mESC-specific enhancers) by domain type. (I) Transcription (FPKM) for genes associated with promoters or enhancers located in each domain type. Dotted lines in B–F left panels indicate genome-wide average for each category plotted. Statistical analysis for enrichment was performed using GAT with 1,000 permutations each; all other statistical analysis was performed using ANOVA Kruskal-Wallis test with Dunn's multiple comparisons; see Supplemental Tables S2 and S3.
Figure 5.
Figure 5.
KODs are enriched for poised enhancers that become activated through differentiation. (A) Domain-wide average density per Mb of each domain category for enhancers in undifferentiated mESCs plotted by indicated enhancer state: active, primed, and poised. (B) Domain-wide average density per Mb of each domain category for enhancers that were poised in mESCs and transitioned to active in differentiated AntNPCs. Dotted lines in A–B indicate genome-wide average density for each category plotted. (C) Enrichment (fold change observed over expected for randomly permuted genomic regions of equal size) by domain type for active enhancers (in mESCs; left panel) and poised-to-active enhancers (in AntNPCs; right panel). Statistical analysis for enrichment was performed using GAT with 1000 permutations each; see Supplemental Table S3.
Figure 6.
Figure 6.
Model: KODs organize the genome at the nuclear periphery and provide a scaffold for distal enhancers.

Similar articles

Cited by

References

    1. Poleshko A., Shah P.P., Gupta M., Babu A., Morley M.P., Manderfield L.J., Ifkovits J.L., Calderon D., Aghajanian H., Sierra-Pagan J.E.et al. .. Genome-nuclear lamina interactions regulate cardiac stem cell lineage restriction. Cell. 2017; 171:573–587. - PMC - PubMed
    1. Towbin B.D., Gonzalez-Sandoval A., Gasser S.M.. Mechanisms of heterochromatin subnuclear localization. Trends Biochem. Sci. 2013; 38:356–363. - PubMed
    1. Peric-Hupkes D., Meuleman W., Pagie L., Bruggeman S.W., Solovei I., Brugman W., Graf S., Flicek P., Kerkhoven R.M., van Lohuizen M.et al. .. Molecular maps of the reorganization of genome-nuclear lamina interactions during differentiation. Mol. Cell. 2010; 38:603–613. - PMC - PubMed
    1. Andrey G., Mundlos S.. The three-dimensional genome: regulating gene expression during pluripotency and development. Development. 2017; 144:3646–3658. - PubMed
    1. Buchwalter A., Kaneshiro J.M., Hetzer M.W.. Coaching from the sidelines: the nuclear periphery in genome regulation. Nat. Rev. Genet. 2019; 20:39–50. - PMC - PubMed

Publication types