. 2021 Nov;109(5):510-524.
doi: 10.1007/s00223-021-00864-x. Epub 2021 May 22.

Investigating the Microchannel Architectures Inside the Subchondral Bone in Relation to Estimated Hip Reaction Forces on the Human Femoral Head

Affiliations

Investigating the Microchannel Architectures Inside the Subchondral Bone in Relation to Estimated Hip Reaction Forces on the Human Femoral Head

Shahed Taheri et al. Calcif Tissue Int. 2021 Nov.

Abstract

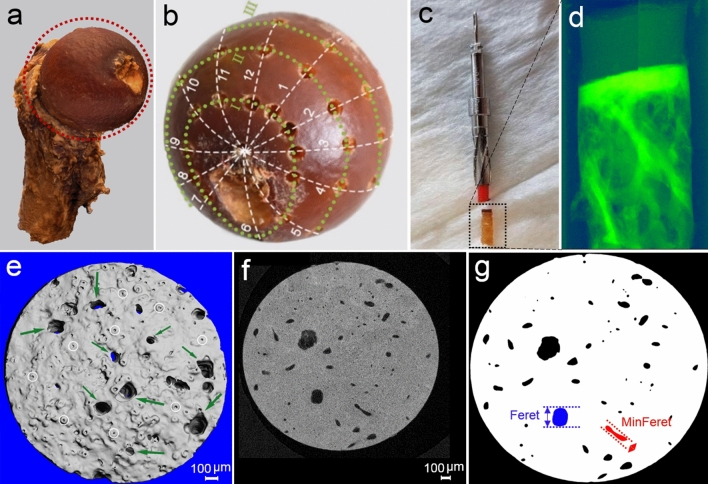
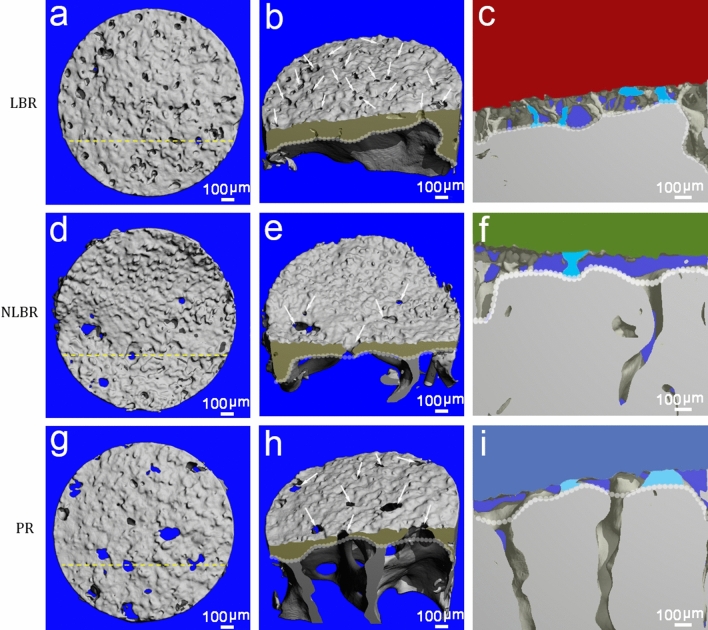
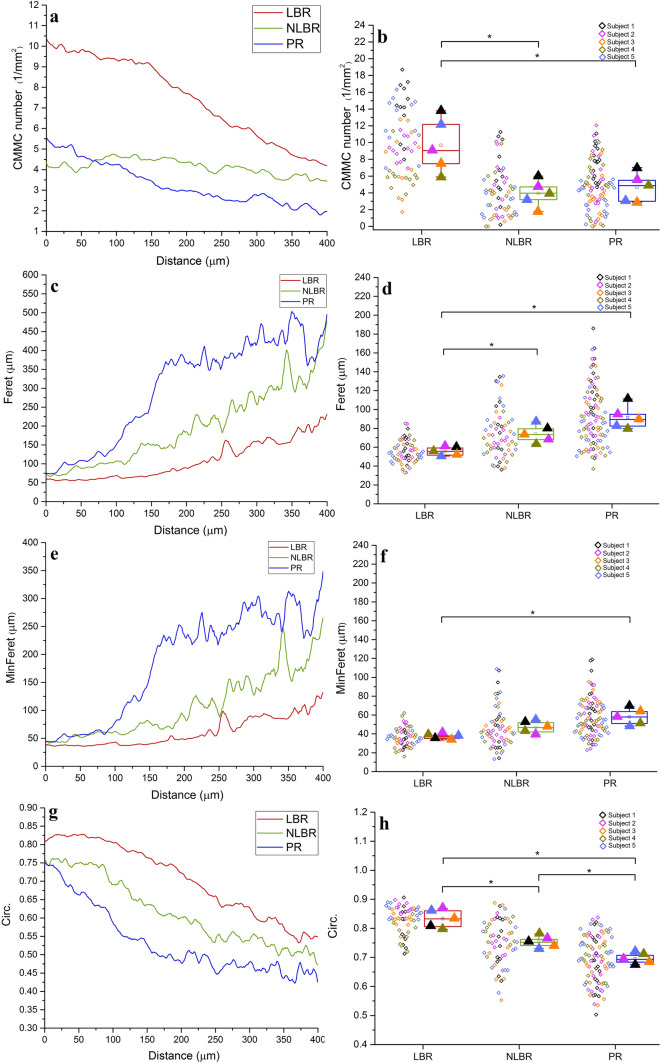
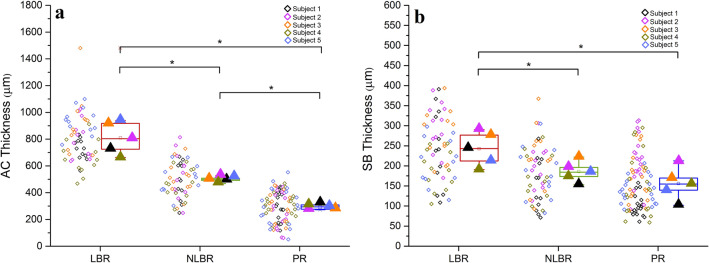
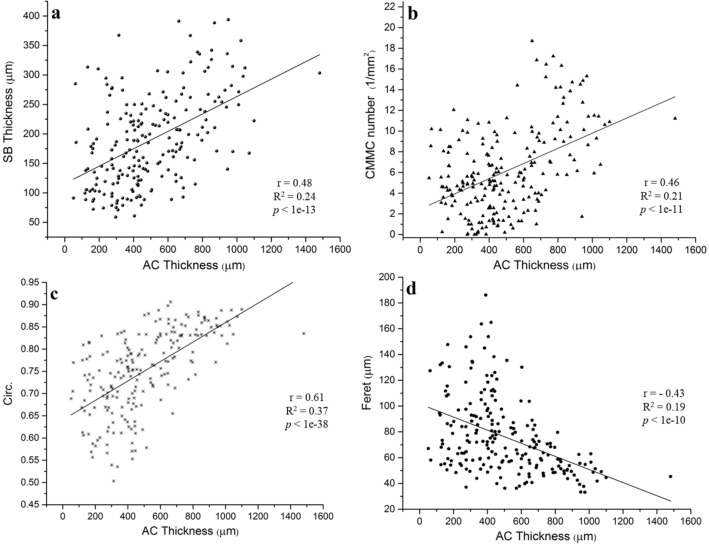
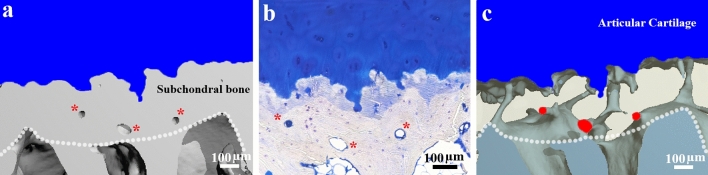
The interplay between articular cartilage (AC) and subchondral bone (SB) plays a pivotal role in cartilage homeostasis and functionality. As direct connective pathways between the two are poorly understood, we examined the location-dependent characteristics of the 3D microchannel network within the SB that connects the basal cartilage layer to the bone marrow (i.e. cartilage-bone marrow microchannel connectors; CMMC). 43 measuring points were defined on five human cadaveric femoral heads with no signs of osteoarthritis (OA) (age ≤ 60), and cartilage-bone cylinders with diameters of 2.00 mm were extracted for high-resolution scanning (n = 215). The micro-CT data were categorized into three groups (load-bearing region: LBR, n = 60; non-load-bearing region: NLBR, n = 60; and the peripheral rim: PR, n = 95) based on a gait analysis estimation of the joint reaction force (young, healthy cohort with no signs of OA). At the AC-SB interface, the number of CMMC in the LBR was 1.8 times and 2.2 times higher compared to the NLBR, and the PR, respectively. On the other hand, the median Feret size of the CMMC were smallest in the LBR (55.2 µm) and increased in the NLBR (73.5 µm; p = 0.043) and the PR (89.1 µm; p = 0.043). AC thickness was positively associated with SB thickness (Pearson's r = 0.48; p < 1e-13), CMMC number. (r = 0.46; p < 1e-11), and circularity index (r = 0.61; p < 1e-38). In conclusion, our data suggest that regional differences in the microchannel architecture of SB might reflect regional differences in loading.

Keywords: Bone micro-CT; Bone microarchitecture; Cartilage-bone marrow microchannel connectors; Gait analysis; Human femoral head; Subchondral bone.


Figures

Fig. 1
Fig. 1
A Schematic overview of the experimental workflow. a 3D model of a formalin-fixed healthy human femur. b 43 measuring points were defined as the intersections of twelve concentric lines and four parallel parasagittal planes (labeled with Roman numerals). c 2.00-mm cylindrical specimens were extracted from each measuring point by a trephine burr, and scanned. d The scout view of an exemplary sample, showing the low-density articular cartilage and the high-density subchondral bone. e The superior view of a 3D-reconstructed sample showed cartilage-bone marrow microchannel connectors (CMMC) at the top surface of the SB (marked by green arrows), which are distinguished from surface imperfections and craters (white circles). The grey-scale images f were binarized g for quantification. The schematic description of the CMMC size metrics (i.e. maximum and caliper diameter, Feret and MinFeret, respectively) are presented for two exemplary microchannels as the lengths between the parallel dotted lines
Fig. 2
Fig. 2
Joint reaction force at the right hip. a Magnitude [N/BW] and orientation of the estimated hip reaction force throughout the time window of analysis, which starts at the left toe off and ends at the subsequent right heel contact (group average). The solid line is the inter-participant mean, and the dashed line indicates the inter-participant standard deviation. Color of each arrow indicates the temporal sequence. b The tracing of the intersection between the group-average normalized hip reaction force vector and a unit sphere, which represents the femoral head, during the time window of analysis. Each instant of intersection is plotted as a circle with a non-zero diameter for easier visualization. The unit sphere is viewed at azimuth of -15° (the average anteversion angle) and elevation of 50°, with the origin of the reference frame at the center of the sphere (azimuth and elevation of 0° shows the sagittal plane from the medial side. c Consequently, probable loading areas are distinguished and color-coded: load-bearing region (LBR; red), non-load-bearing region (NLBR; green), and the peripheral rim (PR; blue). The gray circle within the NLBR is the fovea capitis. The asymmetry in the inferomedial part of the PR is due to the inherent extension of the neck close to the fovea
Fig. 3
Fig. 3
The 3D representation of the CMMC of the SB in healthy human femoral heads. a The superior view of a typical LBR sample revealed abundant microchannels reaching to the most superficial surface of the SB. b The cross-section of the same sample at an arbitrary plane (yellow dotted line in a), showed individual microchannels (white arrows) passing through the SB (dark yellow). c In the inverted, "negative" model of the exact cross-section, cartilage of the LBR is shown in red, osseous structures in transparent, and the CMMC in grey. Individual microchannels cut by the cross-section are shown in cyan. The superior, cross-section, and the negative views of the NLBR and the PR are illustrated in (d-f) and (g-i,) where cartilage is depicted in green (f) and blue (i), respectively. The white dotted lines in the images of the central and the right columns signify the lower margin of the subchondral bone plate
Fig. 4
Fig. 4
Quantitative characterization of the cartilage-bone marrow microchannel connectors. The profile of the CMMC number, Feret, MinFeret, and Circ. vs. distance from the tidemark for different identified regions are illustrated in (a, c, e, and g), respectively. In the uppermost 50 µm of the subchondral bone, the changes of the CMMC number (b) Feret (d), MinFeret (f), and Circ. (h) are shown as boxplots. Each oblique square adjacent to the boxplots represents the mean value of a measuring point, and is color-coded to its corresponding subject. The filled triangles signify the mean values of corresponding subjects in each identified region. *p < 0.05
Fig. 5
Fig. 5
a The changes of the AC thickness, and b the SB thickness in different identified areas of the femoral head. Each oblique square adjacent to the boxplots represents the mean value of a measuring point, color-coded to its corresponding subject. The filled triangles signify the mean values of corresponding subjects in each potential loading region. The statistical significance was based on a Friedman test followed by Wilcoxon signed-rank tests for pairwise comparison. *p < 0.05
Fig. 6
Fig. 6
Local correlation of AC thickness with different variables of SB microarchitecture in all the biopsies (n = 215) from the five subjects with no signs of osteoarthritis. a SB thickness, b CMMC number, c Circ. and d Feret. Each dot in sub-figures represents the corresponding mean value of a measuring point in the uppermost 50 µm of the subchondral bone
Fig. 7
Fig. 7
Three representations for the same cross-section of the AC-SB interface. a The 3D image showed the subchondral plate and isolated microporous structures (marked by red asterisks). The white dotted line signified the lower margin of the subchondral bone plate. b In the Toluidine blue staining the undulating AC-SB interface, the calcified cartilage layer (pastel navy blue), and the identical microporous features are shown. c The "negative" image revealed that the previously-observed microporous structures (marked in red) extended to the background, and were in fact part of the CMMC of the SB

Similar articles

Cited by

References

    1. Loeser RF, Goldring SR, Scanzello CR, Goldring MB. Osteoarthritis: a disease of the joint as an organ. Arthritis Rheum. 2012;64:1697–1707. doi: 10.1002/art.34453. - DOI - PMC - PubMed
    1. Chen D, Shen J, Zhao W, Wang T, Han L, Hamilton JL, Im H-J. Osteoarthritis: toward a comprehensive understanding of pathological mechanism. Bone Res. 2017;5:16044. doi: 10.1038/boneres.2016.44. - DOI - PMC - PubMed
    1. Muschter D, Fleischhauer L, Taheri S, Schilling AF, Clausen-Schaumann H, Grässel S. Sensory neuropeptides are required for bone and cartilage homeostasis in a murine destabilization-induced osteoarthritis model. Bone. 2020;133:e115181. doi: 10.1016/j.bone.2019.115181. - DOI - PubMed
    1. Sharma A, Jagga S, Lee S-S, Nam J-S. Interplay between cartilage and subchondral bone contributing to pathogenesis of osteoarthritis. Int J Mol Sci. 2013;14:19805–19830. doi: 10.3390/ijms141019805. - DOI - PMC - PubMed
    1. Li G, Yin J, Gao J, Cheng TS, Pavlos NJ, Zhang C, Zheng MH. Subchondral bone in osteoarthritis: insight into risk factors and microstructural changes. Arthritis Res Ther. 2013;15:223. doi: 10.1186/ar4405. - DOI - PMC - PubMed

Publication types