. 2021 Jun;78(12):5213-5223.
doi: 10.1007/s00018-021-03859-x. Epub 2021 May 23.

Two positively charged amino acid side-chains in the inner vestibule of the CFTR channel pore play analogous roles in controlling anion binding and anion conductance

Affiliations

Two positively charged amino acid side-chains in the inner vestibule of the CFTR channel pore play analogous roles in controlling anion binding and anion conductance

Paul Linsdell et al. Cell Mol Life Sci. 2021 Jun.

Abstract

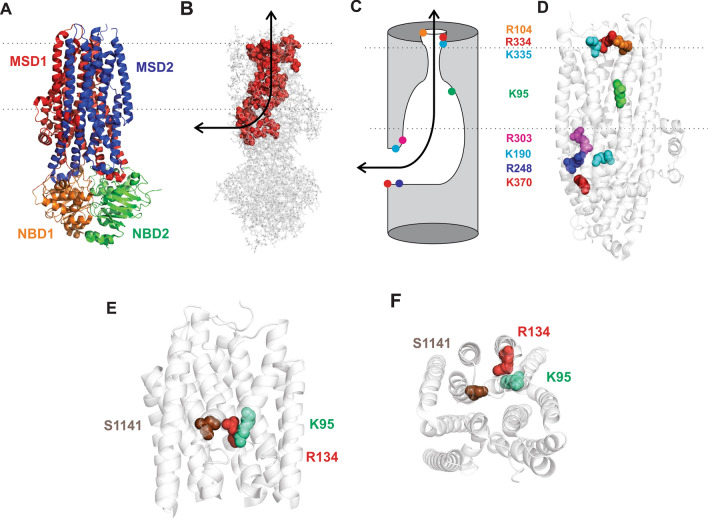
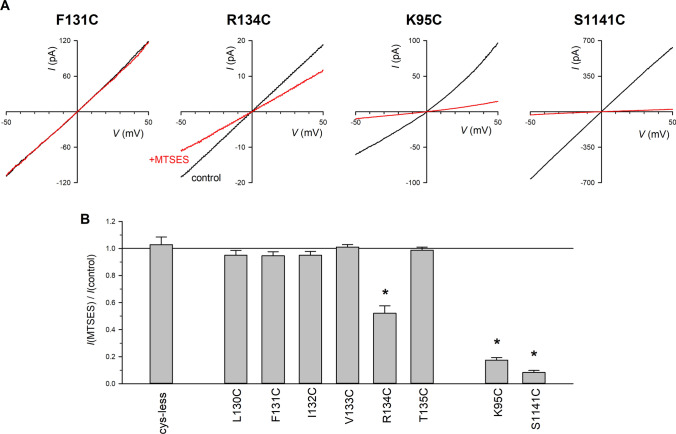
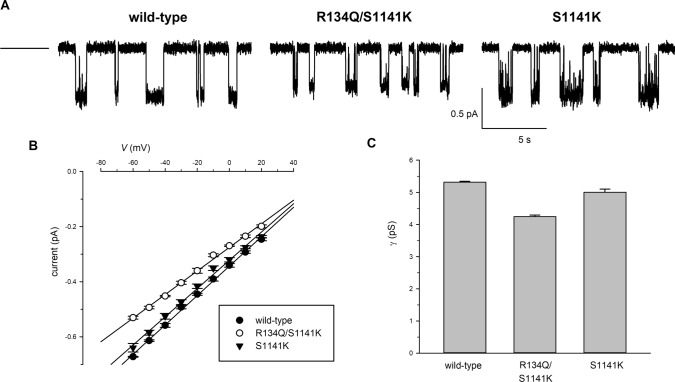
Positively charged amino acid side-chains play important roles in anion binding and permeation through the CFTR chloride channel. One pore-lining lysine residue in particular (K95) has been shown to be indispensable for anion binding, conductance, and selectivity. Here, we use functional investigation of CFTR to show that a nearby arginine (R134) plays a functionally analogous role. Removal of this positive charge (in the R134Q mutant) drastically reduces single-channel conductance, weakens binding of both permeant and blocking anions, and abolishes the normal anion conductance selectivity pattern. Each of these functional effects was reversed by a second-site mutation (S1141K) that introduces an ectopic positive charge to a nearby pore-lining residue. Substituted cysteine accessibility experiments confirm that R134-but not nearby residues in the same transmembrane helix-is accessible within the pore lumen. These results suggest that K95 and R134, which are very close together within the inner vestibule of the pore, play analogous, important roles, and that both are required for the normal anion binding and anion conductance properties of the pore. Nevertheless, that fact that both positive charges can be "transplanted" to other sites in the inner vestibule with little effect on channel permeation properties indicates that it is the overall number of charges-rather than their exact locations-that controls pore function.

Keywords: Anion permeation; Channel pore; Channel structure; Chloride channel; Cystic fibrosis transmembrane conductance regulator.


Conflict of interest statement

The authors declare that they have no competing interest.

Figures

Fig. 1
Fig. 1
Structural views of the CFTR channel pore. A Atomic structure of human CFTR in a phosphorylated, ATP-bound state [3]. This state is expected to resemble the open channel conformation, however, the pore remains closed to Cl permeation at its extracellular end [3]. Different colours reflect the domain organization of CFTR, representing two membrane-spanning domains (MSDs) and two cytoplasmic NBDs. The cytoplasmic regulatory domain is absent from this structure. B Same structure showing the location of putative pore-lining amino acid side-chains (as space-filling models in red) [4, 5, 34]. As reviewed recently [35], cytoplasmic anions access the central transmembrane pore via a lateral portal located on the intracellular side of the membrane (black arrow). C Cartoon model of the pore, based on earlier reviews [4, 35], illustrating the location of important positively charged pore-lining side-chains. Cytoplasmic anions are attracted to the lateral portal by several positive charges (K190, R248, R303, K370), before passing into the wide inner vestibule, where they interact with the positive charge associated with K95. Beyond this lies the narrow region of the pore, which is uncharged. The outer vestibule is also decorated with a number of positive charges, viz. R104, R334, K335. D Location of these positively charged side-chains within the MSDs. Same structure as in A, but with the NBDs removed for clarity. Same colour scheme as in C. Dotted lines indicate the approximate extent of the membrane in AD. E, F Relative location of amino acids mutated in the present study, in a close view of the TMs from A. E Viewed from the side, as in AD; F viewed from the extracellular side of the membrane. The distances between these side-chains (β carbon–β carbon distance) as measured from these structures are: K95-R134 6.7 Å; K95-S1141 12.1 Å; R134-S1141 11.6 Å
Fig. 2
Fig. 2
Protein expression of different CFTR variants expressed in BHK cells. A Representative Western blot for CFTR using protein from BHK cells transfected with the named CFTR variant. The locations of Band B (~ 150 kDa) and Band C (~ 175 kDa) are indicated to the left. Cys-less was used as a control CFTR variant that fails to generate significant amounts of Band C protein in BHK cells cultured at 37 °C [27]. B Mean abundance of Band C protein (as a percentage of total) as determined by densitometric analysis. Asterisks indicate a significant difference from wild-type (p < 0.00001). Mean of data from five independent transfections
Fig. 3
Fig. 3
Modification of pore-lining cysteine side-chains by cytoplasmically applied MTSES. A Example IV relationships for F131C, R134C, K95C and S1141C recorded before (black) and after (red) addition of MTSES (200 µM) to the intracellular solution. B Mean effect of MTSES on macroscopic current amplitude. Asterisk indicates a significant change in macroscopic current amplitude (p < 0.05). Mean of data from 3–7 patches
Fig. 4
Fig. 4
Single channel current amplitude in different CFTR variants. A Example single-channel currents carried by the named channel variants at a membrane potential of − 50 mV. The closed state is indicated by the line to the far left. B Mean single-channel current–voltage relationships for wild-type (black circle), R134Q/S1141K (white circle), and S1141K (black down-pointing triangle). C Mean single-channel conductance (γ) measured from the slope of the current–voltage relationship from individual patches. Mean of data from 5 patches for each channel variant
Fig. 5
Fig. 5
Block of Cl permeation by intracellular Au(CN)2. A Example IV relationships for wild-type, R134Q, and R134Q/S1141K, recorded before (control) and after sequential addition of 100 µM and 1 mM Au(CN)2 to the intracellular solution. B, C Mean fraction of control current remaining after addition of different concentrations of Au(CN)2 at membrane potentials of − 100 mV (B) and − 40 mV (C) for these same channel variants (black circle wild-type; white circle R134Q; black down-pointing triangle R134Q/S1141K). Data have been fitted as described in “Materials and methods”. Mean of data from 3–6 patches. D Mean KD values for different channel variants obtained from such fits as a function of membrane potential (black circle wild-type; white circle R134Q; black down-pointing triangle R134Q/S1141K; white up-pointing triangle S1141K). Mean of data from 6–8 patches
Fig. 6
Fig. 6
Block of Cl permeation by intracellular NPPB. A Example IV relationships for wild-type, R134Q, and R134Q/S1141K, recorded before (control) and after addition of 50 µM NPPB to the intracellular solution. B Mean fraction of control current remaining after addition of this concentration of NPPB, at a membrane potential of − 100 mV. Asterisks indicate a significant difference from wild-type (*p < 0.002; **p < 10–6). Mean of data from 5 patches
Fig. 7
Fig. 7
Relative conductance of different intracellular anions in CFTR. A Example IV relationships recorded from eight different inside-out patches containing wild-type, R134Q, R134Q/S1141K, or S1141K as indicated. In each case, currents were recorded during perfusion with the named anion in the intracellular (bath) solution. Note that changes in current amplitude following perfusion with different anions were fully reversible on returning to Cl-containing perfusate (not shown). B Mean relative anion conductance (GX/GCl) for the different anions indicated, estimated from changes in the slope of macroscopic IV relationships such as those shown in A, as described in “Materials and methods”. Mean of data from 3–7 patches

Similar articles

Cited by

References

    1. Castellani C, Assael BM. Cystic fibrosis: a clinical view. Cell Mol Life Sci. 2017;74:129–140. doi: 10.1007/s00018-016-2393-9. - DOI - PMC - PubMed
    1. Liu F, Zhang Z, Csanády L, Gadsby DC, Chen J. Molecular structure of the human CFTR ion channel. Cell. 2017;169:85–95. doi: 10.1016/j.cell.2017.02.024. - DOI - PubMed
    1. Zhang Z, Liu F, Chen J. Molecular structure of the ATP-bound, phosphorylated human CFTR. Proc Natl Acad Sci USA. 2018;115:12757–12762. doi: 10.1073/pnas.1815287115. - DOI - PMC - PubMed
    1. Linsdell P. Architecture and functional properties of the CFTR channel pore. Cell Mol Life Sci. 2017;74:67–83. doi: 10.1007/s00018-016-2389-5. - DOI - PMC - PubMed
    1. Hwang T-C, Yeh J-T, Zhang J, Yu Y-C, Yeh H-I, Destefano S. Structural mechanisms of CFTR function and dysfunction. J Gen Physiol. 2018;150:539–570. doi: 10.1085/jgp.201711946. - DOI - PMC - PubMed

Grants and funding

LinkOut - more resources