

doi: 10.1161/HYPERTENSIONAHA.121.17267.
Epub 2021 May 24.
Induction of the PPARγ (Peroxisome Proliferator-Activated Receptor γ)-GCM1 (Glial Cell Missing 1) Syncytialization Axis Reduces sFLT1 (Soluble fms-Like Tyrosine Kinase 1) in the Preeclamptic Placenta
Affiliations
- PMID: 34024123
- PMCID: PMC8312350
- DOI: 10.1161/HYPERTENSIONAHA.121.17267
Item in Clipboard
Induction of the PPARγ (Peroxisome Proliferator-Activated Receptor γ)-GCM1 (Glial Cell Missing 1) Syncytialization Axis Reduces sFLT1 (Soluble fms-Like Tyrosine Kinase 1) in the Preeclamptic Placenta
Hypertension.
2021 Jul.
Abstract
[Figure: see text].
Keywords: arteries; placenta; preeclampsia; pregnancy; stillbirth; trophoblast.
Figures
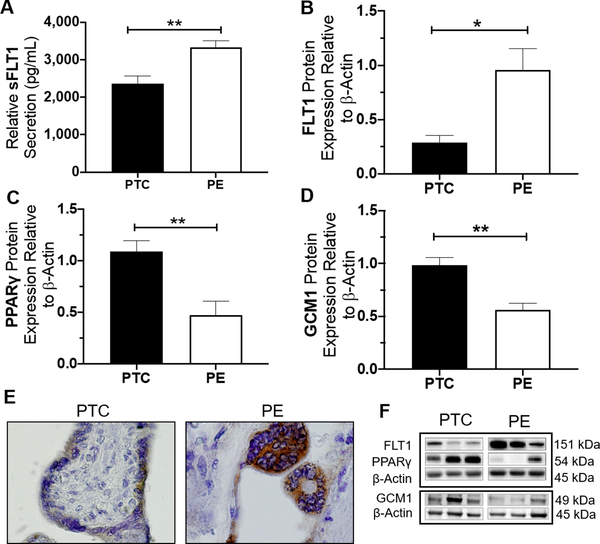
sFLT1 secretion was significantly higher secreted by sPE compared to gestational-age matched control (PTC) (2361.3±198pg vs. 3326.8±178.8pg, p=0.0067, n=5) (A). This finding corresponds with higher expression of FLT1 protein in sPE compared to control (p=0.0167, n=6) (B). Immunostaining for total-FLT1 (FLT1 and sFLT1 variants) shows light staining in the syncytiotrophoblast of PTC tissues compared to a more intense signal in sPE placenta (E). Immunoblotting assessment revealed sPE placentas exhibit lower protein expression of PPARγ (p=0.0042, n=6) and GCM1 (p=0.000, n=14) compared to PTC (C, D). Representative western blots are shown in (F).
(Relative mRNA and protein expression were determine by normalization to housekeeping genes or protein, followed by a student’s t-test to determine significant differences between groups, * p<0.05, ** p<0.01, Rosi=Rosiglitazone, T007=T0070907, bar plots and data reported are presented mean ± SEM, PE = preeclampsia, PTC = preterm healthy control, SN = Syncytial Knots, scale bar = 50 μm, bar plots are presented as mean ± SEM.).
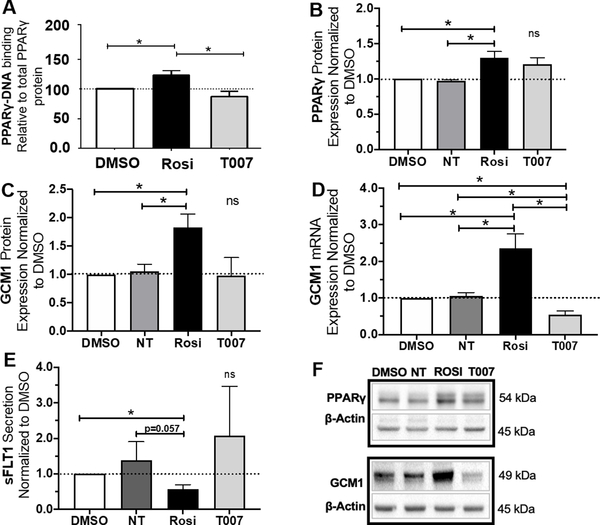
Treatment with Rosiglitazone caused a significant increase in PPARγ activity (p<0.05, n=3) (A). T0070907 did not cause a significant change in PPARγ activity (A). Rosiglitazone significantly upregulated PPARγ (p=0.0446, n=4) and GCM1 (p=0.0402, n=4) protein expression (B, C, F). T0070907 did not cause a significant change in PPARγ or GCM1 protein expression (B, C, F). Rosiglitazone significantly upregulated GCM1 mRNA expression (p=0.0433, n=4) (D). T0070907 significantly reduced GCM1 mRNA expression (p=0.02, n=4) (D). Rosiglitazone also caused a significant reduction in sFLT1 secretion (p=0.025, n=3) (E). Antagonizing PPARγ by T0070907 did not cause a statistically significant change in sFLT1 secretion (E).
(Relative mRNA and protein expression were determine by normalization to housekeeping genes or protein. Relative expression values for individual tissue sets were normalized to DMSO (vehicle control, dotted line, set equal to 1) and subsequent statistical analysis was performed by student’s t-test to determine significant differences between groups,* p<0.05, ns=p>0.05, NT=not treated, Rosi=Rosiglitazone, T007=T0070907, bar plots and data reported are reported as mean ± SEM).
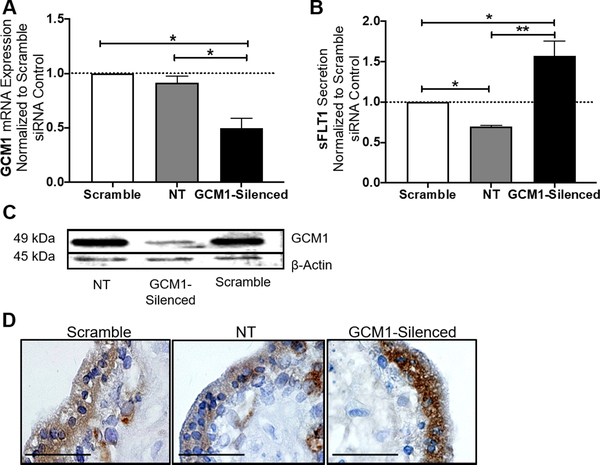
In our first trimester explant model, siRNA-mediated silencing of GCM1 caused a significant reduction of GCM1 mRNA expression (p=0.031, n=3) (A). Similarly, western blot shows GCM1 protein expression appeared to be decreased in the GCM1-silenced tissues in comparison to the scramble siRNA and no-treatment controls (C). sFLT1 secretion was significantly increased in the GCM1-silenced explants (p=0.0389, n=3) (B). Similarly, placental expression of total-FLT1 protein (FLT1 and sFLT1 variants) was induced in the syncytiotrophoblast of the first trimester explants, after GCM1 knockdown (D).
(Relative mRNA expression was normalized to housekeeping genes. sFLT1 secretion (pg/mL) data were normalized based on tissue weight. Relative expression/secretion values for individual tissue sets were normalized to the scramble siRNA control (dotted line, set equal to 1) and subsequent statistical analysis was performed by student’s t-test was performed to determine significant differences between groups, NT=not treated, * p<0.05, ns= p>0.05, bar plots are reported as mean ± SEM).

PPARγ protein expression significantly increased in sPE placenta after Rosiglitazone treatment (p=0.0051, n=4) (A/B). GCM1 mRNA significantly increased in the sPE placenta by Rosiglitazone treatment (p=0.0162, n=9). GCM1 mRNA expression significantly reduced in the sPE placenta after treatment with T0070907 (p=0.001, n=9) (C). sFLT1 mRNA was significantly reduced in the sPE placenta after Rosiglitazone treatment. No significant change in sFLT1 mRNA expression was observed after exposure to T0070907 (B). (Relative mRNA/protein expressions were determined by normalization to respective housekeeping genes/protein. Relative expression values for individual tissue sets were normalized to DMSO (vehicle control, dotted line, set equal to 1) and subsequent statistical analysis was performed by student’s t-test to determine significant differences between groups, *p<0.05, **p<0.01, ns=p>0.05, NT= not treated, Rosi=Rosiglitazone, T007=T0070907, bar plots are reported as mean ± SEM).
References
-
- Lindheimer MD, CHESLEY’S HYPERTENSIVE DISORDERS IN PREGNANCY THIRD EDITION Preface. Chesley’s Hypertensive Disorders in Pregnancy, 3rd Edition, 2009: p. Ix–X.
-
- Zur RL, et al., The Placental Basis of Fetal Growth Restriction. Obstet Gynecol Clin North Am, 2020. 47(1): p. 81–98. - PubMed
Publication types
MeSH terms
Substances
Grants and funding
LinkOut - more resources
Full Text Sources
Other Literature Sources
Molecular Biology Databases
Miscellaneous
