. 2021 Dec;17(12):4119-4140.
doi: 10.1080/15548627.2021.1904489. Epub 2021 May 24.

Modulating FKBP5/FKBP51 and autophagy lowers HTT (huntingtin) levels

Affiliations

Modulating FKBP5/FKBP51 and autophagy lowers HTT (huntingtin) levels

Barbara J Bailus et al. Autophagy. 2021 Dec.

Abstract

Current disease-modifying therapies for Huntington disease (HD) focus on lowering mutant HTT (huntingtin; mHTT) levels, and the immunosuppressant drug rapamycin is an intriguing therapeutic for aging and neurological disorders. Rapamycin interacts with FKBP1A/FKBP12 and FKBP5/FKBP51, inhibiting the MTORC1 complex and increasing cellular clearance mechanisms. Whether the levels of FKBP (FK506 binding protein) family members are altered in HD models and if these proteins are potential therapeutic targets for HD have not been investigated. Here, we found levels of FKBP5 are significantly reduced in HD R6/2 and zQ175 mouse models and human HD isogenic neural stem cells and medium spiny neurons derived from induced pluripotent stem cells. Moreover, FKBP5 interacts and colocalizes with HTT in the striatum and cortex of zQ175 mice and controls. Importantly, when we decreased FKBP5 levels or activity by genetic or pharmacological approaches, we observed reduced levels of mHTT in our isogenic human HD stem cell model. Decreasing FKBP5 levels by siRNA or pharmacological inhibition increased LC3-II levels and macroautophagic/autophagic flux, suggesting autophagic cellular clearance mechanisms are responsible for mHTT lowering. Unlike rapamycin, the effect of pharmacological inhibition with SAFit2, an inhibitor of FKBP5, is MTOR independent. Further, in vivo treatment for 2 weeks with SAFit2, results in reduced HTT levels in both HD R6/2 and zQ175 mouse models. Our studies establish FKBP5 as a protein involved in the pathogenesis of HD and identify FKBP5 as a potential therapeutic target for HD.Abbreviations : ACTB/β-actin: actin beta; AD: Alzheimer disease; BafA1: bafilomycin A1; BCA: bicinchoninic acid; BBB: blood brain barrier; BSA: bovine serum albumin; CoIP: co-immunoprecipitation; DMSO: dimethyl sulfoxide; DTT: dithiothreitol; FKBPs: FK506 binding proteins; HD: Huntington disease; HTT: huntingtin; iPSC: induced pluripotent stem cells; MAP1LC3/LC3:microtubule associated protein 1 light chain 3; MAPT/tau: microtubule associated protein tau; MES: 2-ethanesulfonic acid; MOPS: 3-(N-morphorlino)propanesulfonic acid); MSN: medium spiny neurons; mHTT: mutant huntingtin; MTOR: mechanistic target of rapamycin kinase; NSC: neural stem cells; ON: overnight; PD: Parkinson disease; PPIase: peptidyl-prolyl cis/trans-isomerases; polyQ: polyglutamine; PPP1R1B/DARPP-32: protein phosphatase 1 regulatory inhibitor subunit 1B; PTSD: post-traumatic stress disorder; RT: room temperature; SQSTM1/p62: sequestosome 1; SDS-PAGE: sodium dodecyl sulfate-polyacrylamide gel electrophoresis; TBST:Tris-buffered saline, 0.1% Tween 20; TUBA: tubulin; ULK1: unc-51 like autophagy activating kinase 1; VCL: vinculin; WT: littermate controls.

Keywords: Autophagy; Huntington disease; SAFit2; fkbp12.6/fkbp1b; fkbp12/fkbp1a; fkbp51/fkbp5; fkbp52/fkbp4; induced pluripotent stem cells.


Conflict of interest statement

The authors have no conflicts of interest to declare.

Figures
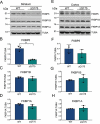
Figure 1.
Figure 1.
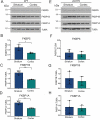
FKBP expression levels in HD zQ175 mouse model. (A) representative western blots analysis of FKBP5, FKBP1B and FKBP1A in WT and zQ175 homozygote mouse striatum at 12 months of age. (B-D) Quantification of the expression levels of FKBP5 (B), FKBP1B (C), and FKBP1A (D) in the striatum normalized to TUBA/α-tubulin. statistically significant difference in FKBP expression is indicated (t-test, **p ≤ 0.01). (E) Representative western blots of FKBP5, FKBP1B and FKBP1A in WT, compared to zQ175 homozygote mouse cortex at 12 months of age. (F-H) Quantification of the expression levels of FKBP5 (F), FKBP1B (G), and FKBP1A (H) in the cortex normalized to TUBA. No statistically significant difference was observed between WT and zQ175 cortex FKBPs expression levels (t-test)
Figure 2.
Figure 2.
FKBP expression levels in HD R6/2 mouse model. (A) representative western blot analysis of FKBP5, FKBP1B and FKBP1A in WT and R6/2 mouse striatum at 4 months of age. (B-D) Quantification of the expression levels of FKBP5 (B), FKBP1B (C), and FKBP1A (D) in the striatum normalized to TUBA. Statistically significant difference in FKBP expression is indicated (t-test, *p ≤ 0.05, **p ≤ 0.01, ***p ≤ 0.001). (E) Representative western blots of FKBP5, FKBP1B and FKBP1A in WT compared to R6/2 mouse cortex at 4 months of age. (F-H) Quantification of the expression levels of FKBP5 (F), FKBP1B (G), and FKBP1A (H) in the cortex normalized to TUBA. No statistically significant difference was observed between WT and R6/2 cortex FKBPs expression levels (t-test)
Figure 3.
Figure 3.
Expression levels of FKBPs in cortex versus striatum in wild-type and zQ175 mice. (A) Representative western blot analysis of FKBP5, FKBP1B and FKBP1A in the striatum and cortex of 12-month-old WT mice. (B-D) Quantification of the expression levels of FKBP5 (B), FKBP1B (C), and FKBP1A (D) in the striatum and cortex normalized to TUBA. statistically significant difference in FKBP expression is indicated (t-test, *p ≤ 0.05, **p ≤ 0.01). (E) Representative western blots of FKBP5, FKBP1B and FKBP1A in the striatum and cortex of 12-month-old homozygote zQ175 mice. (F-H) Quantification of the expression levels of FKBP5 (F), FKBP1B (G), and FKBP1A (H) in the striatum and cortex normalized to TUBA. No statistically significant difference was observed in FKBPs expression levels between striatum and cortex of zQ175 mice (t-test)
Figure 4.
Figure 4.
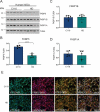
Temporal changes in FKBP5 levels in zQ175 mice. (A,C) representative western blots analysis of striatum (A) and cortex (C) for FKBP5 expression in 6- and 12-month-old mice when compared to homozygote zQ175 to WT. (B,D) Graphs show quantification of the expression levels of FKBP5 when normalized to TUBA. A significant decrease of FKBP5 expression is observed for the striatum (B) and cortex (D) when comparing 12-month-old zQ175 to WT. statistical analysis used ordinary two-way ANOVA (*p ≤ 0.05; **p ≤ 0.01; ***p ≤ 0.001)
Figure 5.
Figure 5.
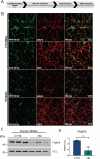
FKBP5 interaction and colocalization with HTT. (A) Cortex and striatal co-immunoprecipitation using α-HTT antibody (Millipore, MAB2166) and probing for FKBP5 in heterozygous allelic HTT mice with increasing polyQ-repeat length. the arrow in the lower left panel indicates the pull down of FKBP5, and the * is IgG protein from the IP. We used heterozygous mice as this was the tissue we had available. additionally, the presence of both WT HTT and mHTT makes this a reasonable comparison. (B) Confocal analysis of HTT (green) and FKBP5 (red) demonstrates the colocalization of FKBP5 and HTT in the cortex in both WT and homozygous zQ175 mice. (C) Quantification of the percentage of HTT colocalizing with FKBP5 (right panel)
Figure 6.
Figure 6.
FKBP5 expression and localization in human neural stem cell model. (A) Representative western blots analysis of FKBP5, FKBP1B and FKBP1A in HD and corrected (C116) NSC. (B-D) Quantification of the expression levels of FKBP5 (B), FKBP1B (C), and FKBP1A (D) in NSC normalized to TUBA. A statistically significant difference in FKBP expression is indicated (t-test, ****p ≤ 0.0001). (E) Immunocytochemistry of HD and C116 NSC stained with FKBP5 (red) and HTT (green) antibodies
Figure 7.
Figure 7.
FKBP5 levels in human medium spiny neurons derived from patient HD induced pluripotent stem cells. (A) Graphical illustration of MSN differentiation protocol. (B) Human C116 and HD MSN model express PPP1R1B/DARPP-32 (green), MAP2 (red) and NES (nestin; red). (C) Expression levels of FKBP5 in HD and C116 human MSN as measured by western blot analysis. (D) Quantification of expression levels of FKBP5 normalized to VCL (vinculin) are shown (**p ≤ 0.01, t-test)
Figure 8.
Figure 8.
Evaluation of HTT levels with genetic or pharmacological inhibition of FKBP5 in neural stem cells. (A) A representative western blot analysis showing the decrease in FKBP5 and HTT levels when treated with FKBP5 siRNA, compared to non-targeting siRNA (NT) and normalized to ACTB. POLYQ antibody 1C2 (Millipore, MAB1574) was used to quantify mHTT levels. (B) Quantification of levels of FKBP5 show a statistically significant decrease in FKBP5 levels upon treatment with FKBP5 siRNA in both genotypes (HD and C116). statistical analysis used ordinary one-way ANOVA and t-test (*p ≤ 0.05, **p ≤ 0.01). (C) The levels of mHTT are significantly (t-test, *p ≤ 0.05) lower (30%) in the siRNA-treated HD cells. (D) Representative western blot analysis of treatment of HD NSC with SAFit2 at 1 and 10 µM probing with HTT and FKBP5 antibodies. HTT antibody (Millipore, MAB2166) was utilized to measure WT and mHTT levels separating the WT and mHTT on 3–8% Tris-acetate gels. PolyQ antibody 1C2 (Millipore, MAB1574) was used to detect only mHTT levels. (E) Quantification of mHTT levels at both 1 µM and 10 µM, when compared to control (*p ≤ 0.05, **p ≤ 0.01). (F) Quantification of normal HTT levels at 1 µM and 10 µM SAFit2 when compared to control. Statistical analysis used ordinary one-way ANOVA and t-test (*p ≤ 0.05)
Figure 9.
Figure 9.
Changes in the expression of LC3 and SQSTM1/p62 with SAFiT2 treatment in HD neural stem cells. (A) A representative western blot analysis showing LC3 and VCL expression after treatment of C116 and HD NSC with SAFit2 at 1 or 10 µM or vehicle (DMSO). (B) C116 NSC treated with 10 µM SAFit2 show increased expression of LC3 (one-way ANOVA, *p = 0.013), compared to vehicle treated cells. In HD NSC, LC3 expression is increased in cells treated with was 10 µM SAFiT2 (one-way ANOVA, ****p ≤ 0.0001), compared to vehicle treated cells. LC3 expression was normalized to VCL expression. 1 µM SAFiT2 compared to 10 µM SAFiT2 was statistically significant (one-way ANOVA, ****p ≤ 0.0001). (C) A representative western blot analysis showing increase expression of SQSTM1 and VCL in C116 and HD after treatment with SAFit2 or DMSO. (D) C116 NSC treated with 10 µM SAFiT2 show a significant increase in SQSTM1 (one-way ANOVA, **p ≤ 0.01) expression, compared to DMSO-treated cells. A significant difference in SQSTM1 expression is also observed between C116 cells treated with 1 vs 10 µM of SAFit2 (one-way ANOVA, **p ≤ 0.01). In HD NSC, expression of SQSTM1 was increased in cells treated with 1 µM (one-way ANOVA, *p ≤ 0.05) and 10 µM SAFit2 (***p ≤ 0.001), compared to DMSO treated cells. A significant difference in SQSTM1 expression is also observed between HD cells treated with 1 or 10 µM of SAFit2 (one-way ANOVA, *p ≤ 0.05). SQSTM1 levels were normalized to VCL expression. (E) C116 and HD NSC were treated with DMSO, Bafilomycin A1 (BafA1), SAFit2, or SAFit2, followed by BafA1. Western blot analysis normalized to VCL shows increased levels of LC3-II after BafA1 (****p ≤ 0.001), SAFit2 (****p ≤ 0.001) and SAFit2 and BafA1 (****p ≤ 0.001) in both C116 and HD NSC
Figure 10.
Figure 10.
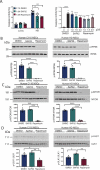
Comparing SAFit2 and rapamycin in HD NSC. (A) Left panel. CASP3-CASP7 activity normalized to protein levels in C116 and HD NSC treated for 24 h in starvation medium with 0.1% DMSO vehicle, 1 µM SAFit2 (two-way ANOVA, *p ≤ 0.05), or 1 µM rapamycin (two-way ANOVA, **p ≤ 0.01). right panel. CASP3-CASP7 activity normalized to protein levels in HD NSC treated for 24 h in starvation media with 0.1% DMSO vehicle, 1, 1.5 and 2 µM SAFit2 (two-way ANOVA, **p ≤ 0.001), or 1, 1.5, and 2.0 µM rapamycin (two-way ANOVA, ***p ≤ 0.001). The two first bars on the left are full media (NPM), media with 0.1% DMSO vehicle, and starvation medium with 0.1% DMSO vehicle. (B,C,D) Quantification of the expression levels of p-RPS6 (B), p-MTOR (C), and p-ULK (D) in C116 and HD NSC after 48 h of treatment with either 0.1% DMSO vehicle, 10 µM SAFit2, or 10 µM rapamycin treatment. analysis of quantified levels indicates significant reduction in phosphorylated RPS6 with 10 µM rapamycin (one-way ANOVA, ****p ≤ 0.0001, and one-way ANOVA, ***p ≤ 0.001) in C116 and HD NSC, respectively, when compared to vehicle control. SAFit2 treatment did not significantly alter levels of phosphorylated RPS6 when compared to control. Analysis of quantified levels indicates significant reduction in phosphorylated MTOR with 10 µM rapamycin (one-way ANOVA, ***p ≤ 0.001, and one-way ANOVA, ****p ≤ 0.0001) in C116 and HD NSC, respectively, when compared to vehicle control.Again, SAFit2 treatment did not significantly alter levels of phosphorylated MTOR when compared to control. analysis of quantified levels indicates significant reduction in phosphorylated ULK1 with 10 µM rapamycin in C116 NSC (one-way ANOVA, *p ≤ 0.05). In HD NSC, treatment with 10 µM SAFit2 significantly increased phosphorylated ULK1 (one-way ANOVA, *p ≤ 0.05) when compared to control
Figure 11.
Figure 11.
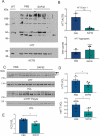
HTT levels in R6/2 and zQ175 mouse models treated with SAFit2. (A) A representative western blot showing HTT exon1 expression and aggregates in R6/2 mice treated with SAFit2, 7.5 mg/kg or vehicle (PBS) for 7 days in the striatum. WT are control is followed by an empty lane. the arrow indicates the polyQ-expanded HTT fragment. the line is the insoluble HTT aggregates that form in the R6/2 mouse. HTT antibody (MilliporeSigma, 5492) was used. (B) Quantification showing a decrease in exon 1 fragments of HTT in R6/2 mice treated with SAFit2 or PBS normalized to ACTB (t-test, **p ≤ 0.01). No significant differences were observed in HTT aggregates. (C) Representative western blot showing expression of HTT, and mHTT normalized to VCL in heterozygote zQ175 mice treated with SAFit2, 15 mg/kg or vehicle (PBS) for 14 days. the thick arrow is the mHTT and the light arrow is WT HTT. (D) Quantification showing normal and mHTT decrease in mice treated with SAFit2 compared to vehicle treated controls (t-test, *p ≤ 0.05). The heavy arrow indicates where mHTT migrates and the lower light arrow is normal HTT. HTT antibody (1:500; MilliporeSigma, MAB5492) was used. (E) Quantification of mHTT using the polyQ antibody 1C2 normalized to VCL showing decreased levels in mice treated with SAFit2 compared to vehicle treated controls (t-test, *p ≤ 0.05)
Figure 12.
Figure 12.
Model of the potential mechanism of clearance of HTT with FKBP5 modulation. (A) The physical interaction and proline isomerization activity of FKBP5 with HTT leads to a conformation of mHTT that is not cleared by autophagy. (B) Decreasing the physical interaction and/or proline isomerization activity of FKBP5 with HTT leads to a conformation state of mHTT that can be cleared by autophagy. This can be mediated by SAFit2 or knockdown of FKBP5

References

    1. Group THsDCR . A novel gene containing a trinucleotide repeat that is expanded and unstable on Huntington’s disease chromosomesThe Huntington’s Disease Collaborative Research Group. Cell. 1993;72(6):971–983. - PubMed
    1. Hedreen JC, Peyser CE, Folstein SE, et al. Neuronal loss in layers V and VI of cerebral cortex in Huntington’s disease. Neurosci Lett. 1991;133(2):257–261. - PubMed
    1. Kiyama H, Seto-Ohshima A, Emson PC.. Calbindin D28K as a marker for the degeneration of the striatonigral pathway in Huntington’s disease. Brain Res. 1990;525(2):209–214. - PubMed
    1. Cardoso F. Differential diagnosis of Huntington’s disease: what the clinician should know. Neurodegener Dis Manag. 2014;4(1):67–72. - PubMed
    1. Marxreiter F, Stemick J, Kohl Z. Huntingtin lowering strategies. Int J Mol Sci. 2020;21(6):21. - PMC - PubMed

Publication types

MeSH terms

Substances