. 2021 May 6:15:646537.
doi: 10.3389/fnins.2021.646537. eCollection 2021.

Tetramethylpyrazine Alleviates Behavioral and Psychological Symptoms of Dementia Through Facilitating Hippocampal Synaptic Plasticity in Rats With Chronic Cerebral Hypoperfusion

Affiliations

Tetramethylpyrazine Alleviates Behavioral and Psychological Symptoms of Dementia Through Facilitating Hippocampal Synaptic Plasticity in Rats With Chronic Cerebral Hypoperfusion

Zihu Tan et al. Front Neurosci. .

Abstract

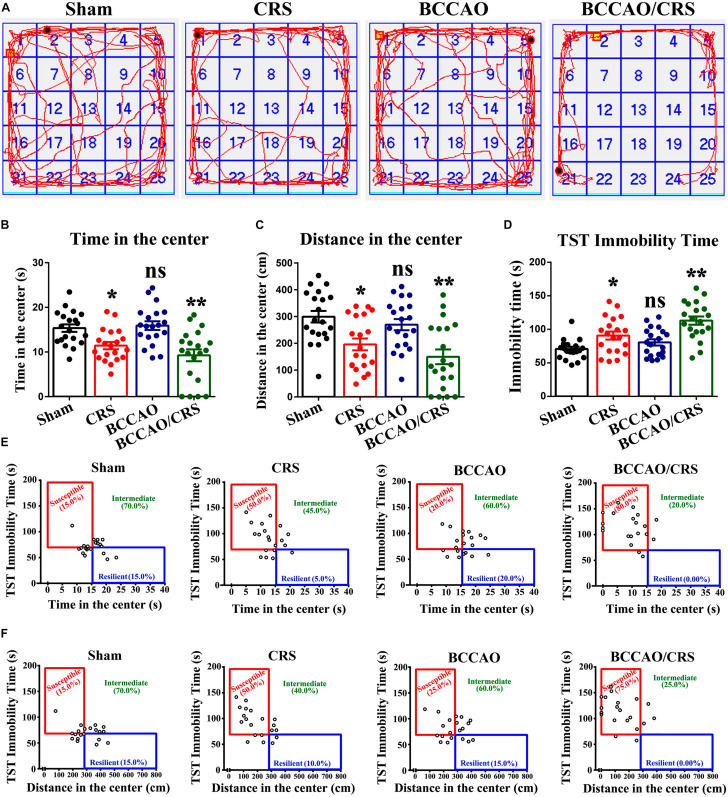
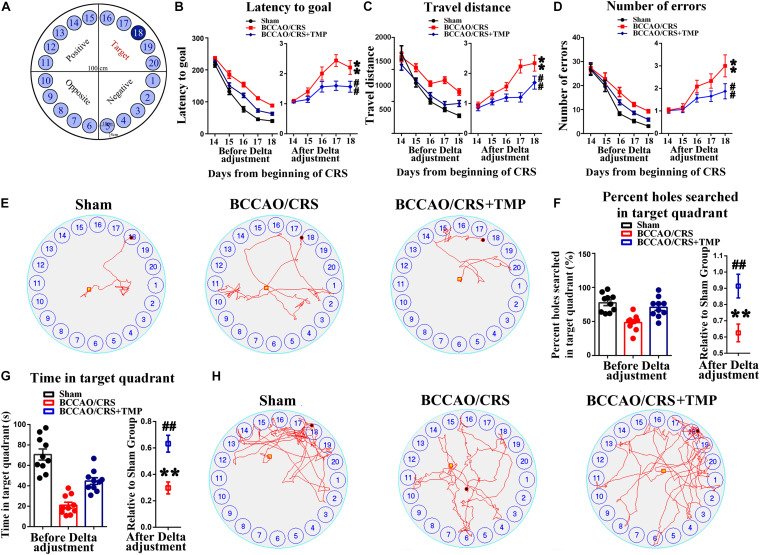
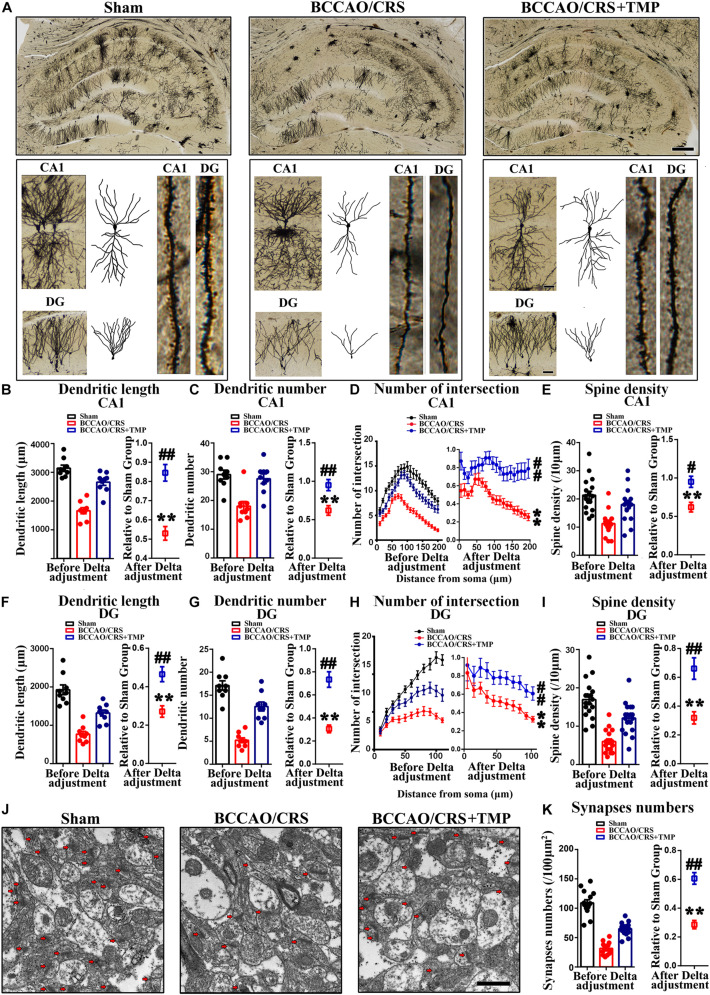
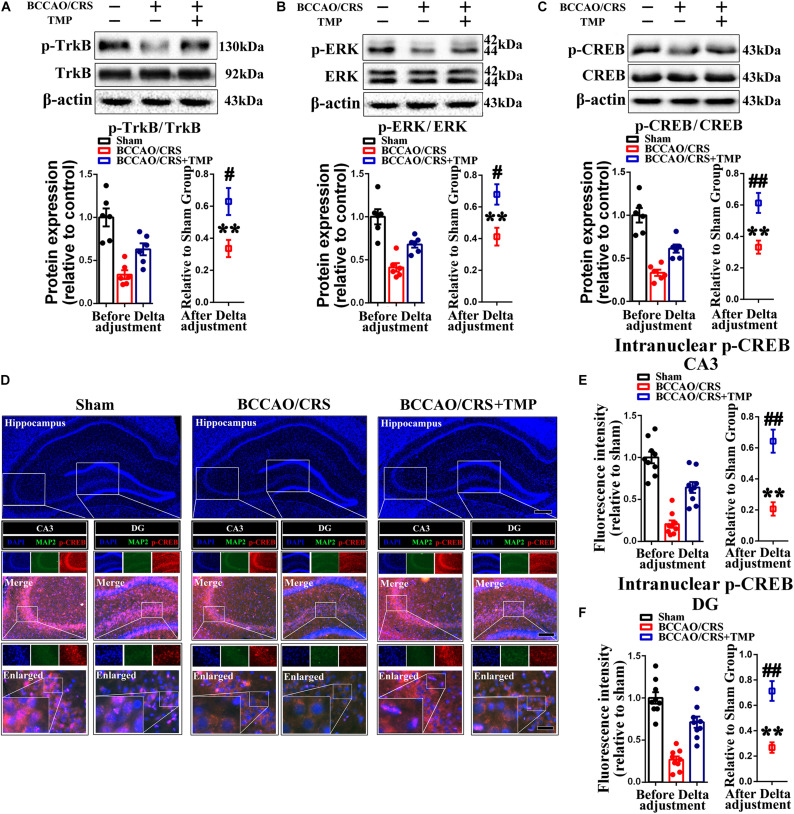
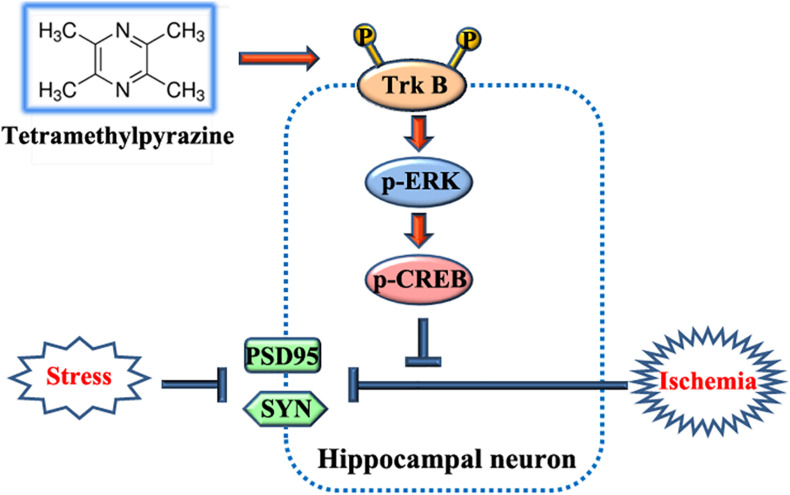
Behavioral and psychological symptoms of dementia (BPSD) ubiquitously disturb all patients with dementia at some point in the disease course. Although a plethora of non-pharmacological and pharmacological methods targeting the relief BPSD have been developed, the therapeutic effect is still far from ideal. Here, a rat BPSD model combining the physiological changes with mental insults was successfully established. Meanwhile, our results indicated that TMP attenuated anxious behavior using an elevated plus maze (EPM) test, ameliorated recognitive ability and sociability through a novel object recognition test (NORT) and social interaction test (SIT), and improved learning and memory impairments via a Barnes maze in rats with bilateral common carotid arteries occlusion (BCCAO) plus chronic restraint stress (CRS). Given that hippocampus chronic cerebral hypoperfusion (CCH) always causes damage to the hippocampus, and the majority of cognitive impairments, behaviors, and stress responses are associated with pathology in the hippocampus including anxiety and depression, we paid attention to investigate the role of the hippocampus in BPSD. Our results indicated that Tetramethylpyrazine (TMP) attenuated anxiety and ameliorated recognitive ability, sociability, learning, and memory impairments due to alleviating dendritic and spine deficits, and upregulating the expression of synapse-related proteins (including PSD95, SYN, GAP43, SYP) in the hippocampus. We also found that the underlying mechanism was that TMP could activate the TrkB/ERK/CREB signaling pathway to promote synaptic remodeling in vivo and in vitro. Mechanically, the present study enlarges the therapeutic scope of TMP in neurodegenerative disorders and provides basic knowledge and feasible candidates for treating BPSD, particularly for vascular dementia.

Keywords: TrkB/ERK/CREB signaling pathway; behavioral and psychological symptoms of dementia; chronic restraint stress; neurodegenerative disorders; synaptic remodeling; tetramethylpyrazine.


Conflict of interest statement

The authors declare that the research was conducted in the absence of any commercial or financial relationships that could be construed as a potential conflict of interest.

Figures

FIGURE 1
FIGURE 1
Experimental protocol for in vivo and in vitro experiments in the present study. (A) Open field test (OFT) and tail suspension test (TST) were used to test the efficiency of the establishment of the rat BPSD model using a bilateral internal carotid artery occlusion (BCCAO) method combined with chronic restraint stress (CRS) in vivo (Experiment 1). (B) Exploring the effect of Tetramethylpyrazine (TMP) on behavioral recovery using a battery of behavioral assays following BCCAO/CRS in the rat BPSD model in vivo (Experiment 2). (C) Uncovering the role of TrkB/ERK/CREB signaling pathway in TMP exerting neuroprotective effect through fortifying synaptic remolding in vitro experiments (Experiment 3).
FIGURE 2
FIGURE 2
Behavioral tests validate successful establishment of rat BPSD model with severe depression and anxiety. (A) Representational trajectories of rats moving in the open field in different groups. (B) Bar summarizing the total time of rats in the center during open field test (OFT). (C) Quantitation of the total distance of rats in the center during open field test (OFT). (D) Statistical analysis of immobility time of rats in the tail suspension test (TST). (E) The total time in the center during OFT against immobility time during TST indicating the susceptibility to depressive and anxious phenotype in various groups. A median split on both times spent in the center area (median = 15 s) and immobility time (median = 70 s) was used to separate rats into susceptible, intermediate and resilient phenotypes in different groups. (F) The distance in the center during OFT against immobility time during TST delineating the susceptibility to depressive and anxious phenotype in various groups. A median split of distance (median = 280 cm) in the center using OFT and immobility time (median = 70 s) using TST was performed to separate rats into susceptible, intermediate and resilient phenotypes in different groups. *P < 0.05, **P < 0.01, nsP > 0.05 vs. Sham. Data are presented as mean ± SE. n = 20 in each group.
FIGURE 3
FIGURE 3
Tetramethylpyrazine (TMP) administration alleviates depression and anxiety in rats caused by BCCAO/CRS. (A) Representational traces showing rats moving in the elevated plus maze (EPM) test. (B) Bargraph indicating the percentage of time that rats were moving/staying in the open arms. (C) Barchart demonstrating times that rats entered the open arms during EPM test. (D) Quantitation of the stretching number in rats during EPM test. (E) Typical route representing rats moving in the open field. (F) Summarized data demonstrating the total time of rats in the center during OFT. (G) Quantitative data summarizing the total time of rats in the corner during OFT. (H) Quantitative analysis of rats moving distance during the OFT. **P < 0.01 vs. Sham. #P < 0.05, ##P < 0.01, nsP > 0.05 vs. BCCAO/CRS. Data are presented as mean ± SE. n = 10 in each group.
FIGURE 4
FIGURE 4
TMP improves recognitive ability and sociability in BCCAO/CRS rats. (A) Diagrammatic sketch of novel object recognition test (NORT). (B) Time of rats spent on exploring two identical object A and B during the period of familiarization. (C) Time of rats spent on exploring old object A or B and novel object C during the period of recognition. (D) Novel object discrimination index of rats during the period of recognition. (E) Representative traces of rats moving in the 3-chamber sociability test. (F) Time that rats exerting first sniffing at additional rats in the social interaction test (SIT). (G) Bargraph indicating the time of social interaction during SIT. (H) Times that rats entered the chamber 2 during SIT. **P < 0.01, ns1P > 0.05 vs. Sham. #P < 0.05, ##P < 0.01, nsP > 0.05 vs. BCCAO/CRS. Data are presented as mean ± SE. n = 10 in each group.
FIGURE 5
FIGURE 5
TMP ameliorates learning and memory deficits in BCCAO/CRS rats. (A) The diagrammatic sketch of the zone and magnitude of Barnes maze instrument. (B) Chart showing the average latency of rats finding out the escape tunnel in different groups from day 15 to 19. (C) The average traveled distance of rats finding out the escape tunnel in different group from day15 to 19. (D) Total number of errors during experiments in different groups from day 15 to 19. (E) Representative traces of rats finding out the escape tunnel on day 19 in various groups. (F) Percentage holes searched in the target quadrant during the probe trial. (G) Total time of rats spent on exploring the target quadrant during the probe trial. (H) Representative trajectories in the quadrant zone during spatial memory probe trial. ∗∗P < 0.01 vs. Sham. ##P < 0.01 vs. BCCAO/CRS. Data are presented as mean ± SE. n = 10 in each group.
FIGURE 6
FIGURE 6
TMP attenuates dendritic and spine deficits in hippocampus in BCCAO/CRS rats. (A) Representative Golgi-Cox staining images exhibiting dendritic arborization in hippocampal CA1 pyramidal neurons and DG granular neurons in hippocampal slices. Scale bar: 400 μm; and 50 μm for enlarged inserts. (B) Quantification of the length of dendrites in hippocampal CA1 pyramidal neurons. (C) Bar chart indicating the number of dendrites in hippocampal CA1 pyramidal neurons. (D) Quantitative analysis of the number of intersections of dendrites in hippocampal CA1 pyramidal neurons. (E) Spine density of dendrites in hippocampal CA1 pyramidal neurons. (F) Quantification of the length of dendrites in hippocampal DG granular neurons. (G) Quantification of the number of dendrites in hippocampal DG granular neurons. (H) Chart indicating the number of intersections of dendrites in DG granular neurons. (I) Spine density of dendrites in hippocampal DG granular neurons. (J) Representative images of hippocampal synapses under transmission electron microscope (TEM). Scale bar: 1 μm. (K) Quantitative statistics of hippocampal synapses in different groups. **P < 0.01 vs. Sham. #P < 0.05, ##P < 0.01 vs. BCCAO/CRS. Data are presented as mean ± SE. n = 3 in each group, and 3 slices per rat for Golgi-Cox staining, 5 random fields per rat for TEM.
FIGURE 7
FIGURE 7
TMP increases synapse-associated protein expression in BCCAO/CRS rats. (A–D) Representative immunoblots representing the expression and semi-quantitative analysis of synapse-associated proteins including PSD-95 (A), SYN (B), GAP-43 (C), and SYP (D). (E) Representative immunostaining showing the colocalization of MAP (green) and SYN (red) in the hippocampus of CA3 and DG. The inserts were high magnification from each group. Nuclei were counterstained with DAPI. Scale bar: Scale bar: 400 μm; and 200 μm for enlarged inserts. (F) Quantification of the fluorescence intensity of SYN in hippocampal CA3. (G) Bar graph summarizing the fluorescence intensity of SYN in hippocampal DG. **P < 0.01 vs. Sham. #P < 0.05, ##P < 0.01 vs. BCCAO/CRS. Data are presented as mean ± SE. n = 6 per group for Western blotting; n = 3 in each group and 3 slices per rat for immunofluorescence.
FIGURE 8
FIGURE 8
TMP activates TrkB/ERK/CREB signaling pathway to exert neuroprotective effect in BCCAO/CRS rats. (A–C) Typical immunoblots exhibiting the expression and semi-quantitative analysis of proteins related to TrkB/ERK/CREB signaling pathway including p-TrkB (A), p-ERK (B) and p-CREB (C). (D) Representative immunostaining depicting the colocalization of MAP2 (green) and CREB (red) in hippocampus of CA3 and DG. The inserts were high magnification from each group. Nuclei were counterstained with DAPI. Scale bar: Scale bar: 400 μm; 200 μm for medial inserts, and 50 μm for enlarged inserts. (E) Quantification of the optic intensity of intranuclear CREB in hippocampal CA3and DG. (F) Bar chart summarizing the optic intensity of intranuclear p-CREB in hippocampal CA3 and DG. **P < 0.01 vs. Sham. #P < 0.05, ##P < 0.01 vs. BCCAO/CRS. Data are presented as mean ± SE. n = 6 per group for Western blotting; n = 3 in each group and 3 slices per rat for immunofluorescence.
FIGURE 9
FIGURE 9
Activation of TrkB/ERK/CREB signaling pathway protects neurons against injury induced by oxygen glucose deprivation (OGD) condition. (A–C) Representative immunoblots representing the expression and semi-quantitative analysis of proteins related to TrkB/ERK/CREB signaling pathway including p-TrkB (A), p-ERK (B) and p-CREB (C) in different groups. (D) Representative immunostaining exhibiting the colocalization of MAP2 (green) and p-CREB (red) in each group. Nuclei were counterstained with DAPI. Scale bar: Scale bar: 50 μm; and 20 μm for enlarged inserts. (E) Quantification of optic intensity of intranuclear p-CREB in various groups. Data are presented as mean ± SE. n = 6 per group, *P < 0.05, **P < 0.01.
FIGURE 10
FIGURE 10
TMP administration increases synapse-associated protein expression in primary cultured neurons under OGD condition. (A–D) Representative immunoblots representing the expression and semi-quantitative analysis of synapse-associated proteins including PSD-95 (A), SYN (B), GAP-43 (C), and SYP (D). (E) Representational immunostaining of co-labeling of MAP2 (green) and SYN (red) in primary neurons under different groups. Nuclei were counterstained with DAPI. Scale bar: 50 μm. (F) Bar graph illustrating the optic intensity of SYN in different groups. Data are presented as mean ± SE. n = 6 per group, *P < 0.05, **P < 0.01.
FIGURE 11
FIGURE 11
Schematic diagram for the beneficial effects and mechanisms of TMP.

Similar articles

Cited by

References

    1. American Geriatrics Society and American Association for Geriatric Psychiatry (2003). Consensus statement on improving the quality of mental health care in U.S. nursing homes: management of depression and behavioral symptoms associated with dementia. J. Am. Geriatr. Soc. 51 1287–1298. 10.1046/j.1532-5415.2003.51415.x - DOI - PubMed
    1. Arauchi R., Hashioka S., Tsuchie K., Miyaoka T., Tsumori T., Limoa E., et al. (2018). Gunn rats with glial activation in the hippocampus show prolonged immobility time in the forced swimming test and tail suspension test. Brain Behav. 8:e01028. 10.1002/brb3.1028 - DOI - PMC - PubMed
    1. Atti A. R., Ferrari Gozzi B., Zuliani G., Bernabei V., Scudellari P., Berardi D., et al. (2014). A systematic review of metabolic side effects related to the use of antipsychotic drugs in dementia. Int. Psychogeriatr. 26 19–37. 10.1017/s1041610213001658 - DOI - PubMed
    1. Ballard C., Corbett A. (2010). Management of neuropsychiatric symptoms in people with dementia. CNS Drugs 24 729–739. - PubMed
    1. Bessey L. J., Walaszek A. (2019). Management of behavioral and psychological symptoms of dementia. Curr. Psychiatry Rep. 21:66. - PubMed

LinkOut - more resources