

Distinct Gene Expression Patterns of Ion Channels and Cytokines in Rat Primary Sensory Neurons During Development of Bone Cancer and Cancer Pain
- PMID: 34025351
- PMCID: PMC8134751
- DOI: 10.3389/fnmol.2021.665085
Distinct Gene Expression Patterns of Ion Channels and Cytokines in Rat Primary Sensory Neurons During Development of Bone Cancer and Cancer Pain
Abstract
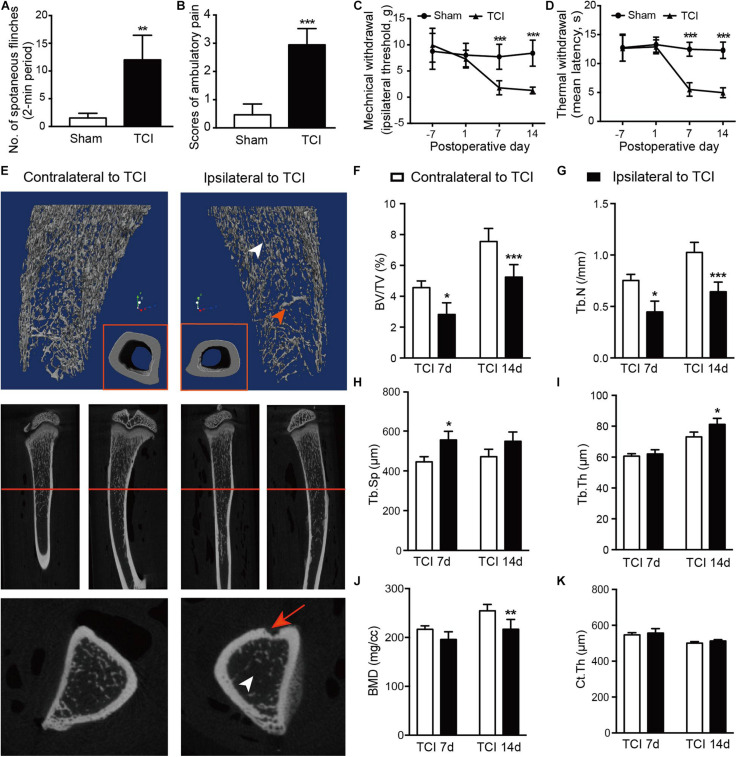
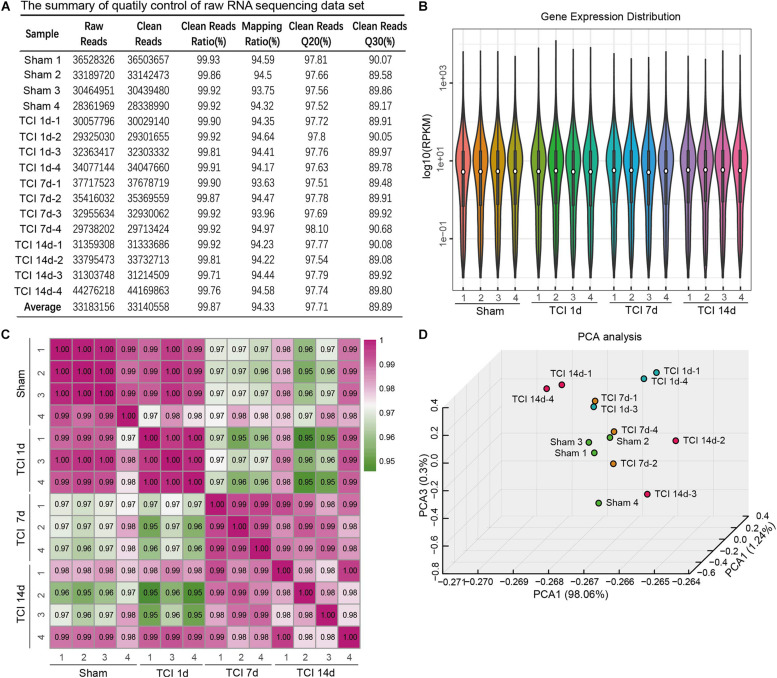
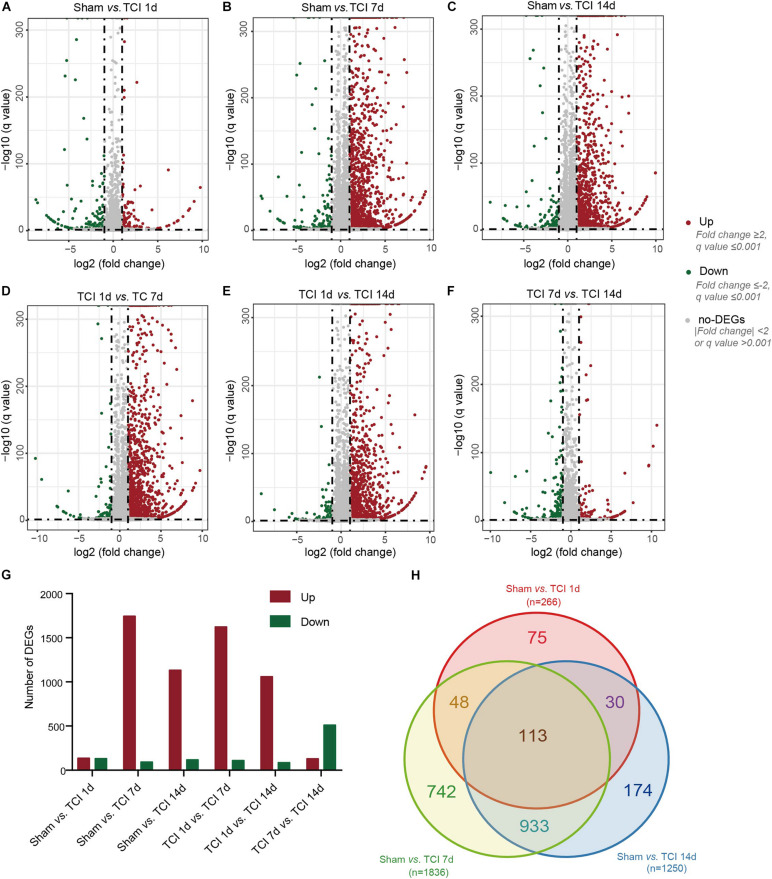
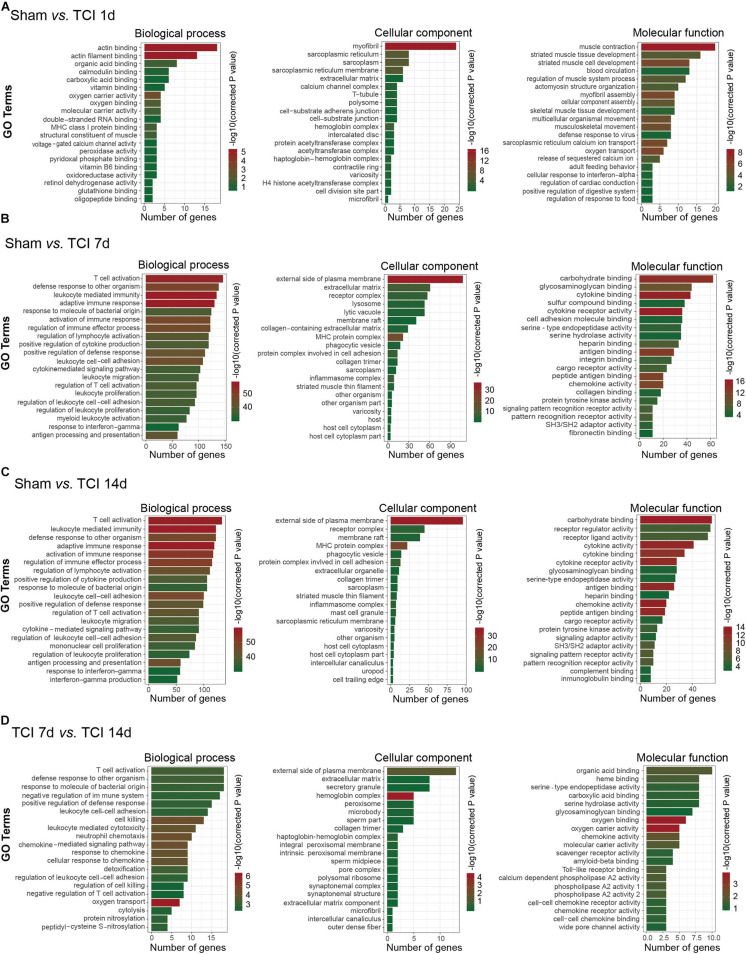
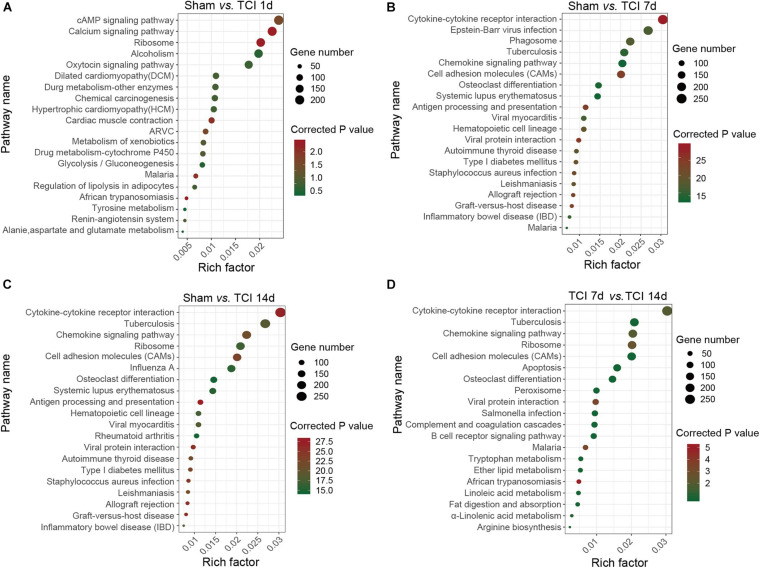
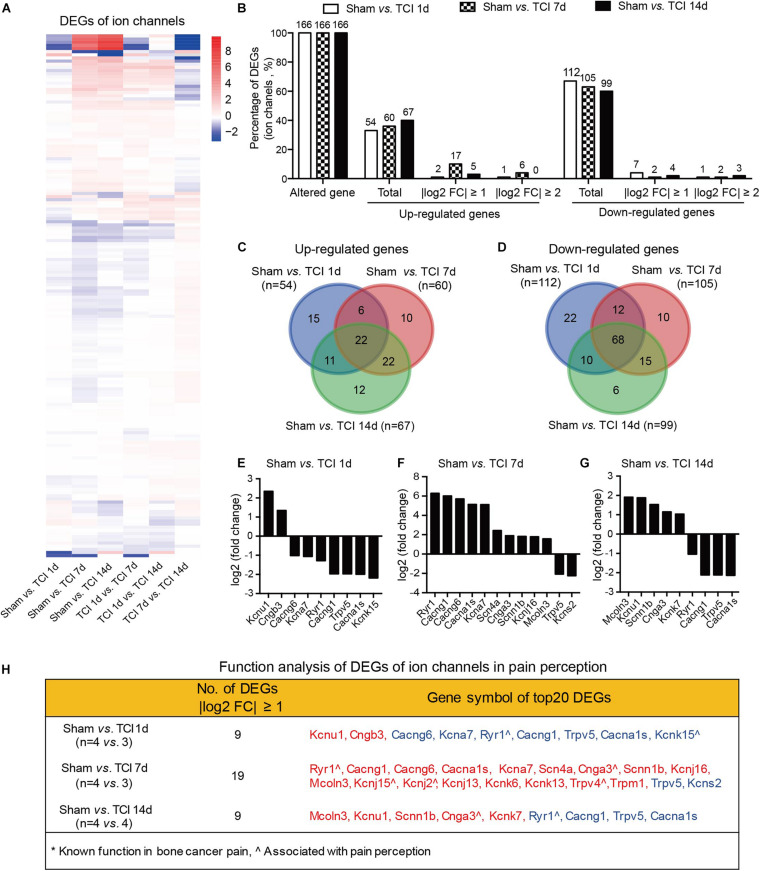
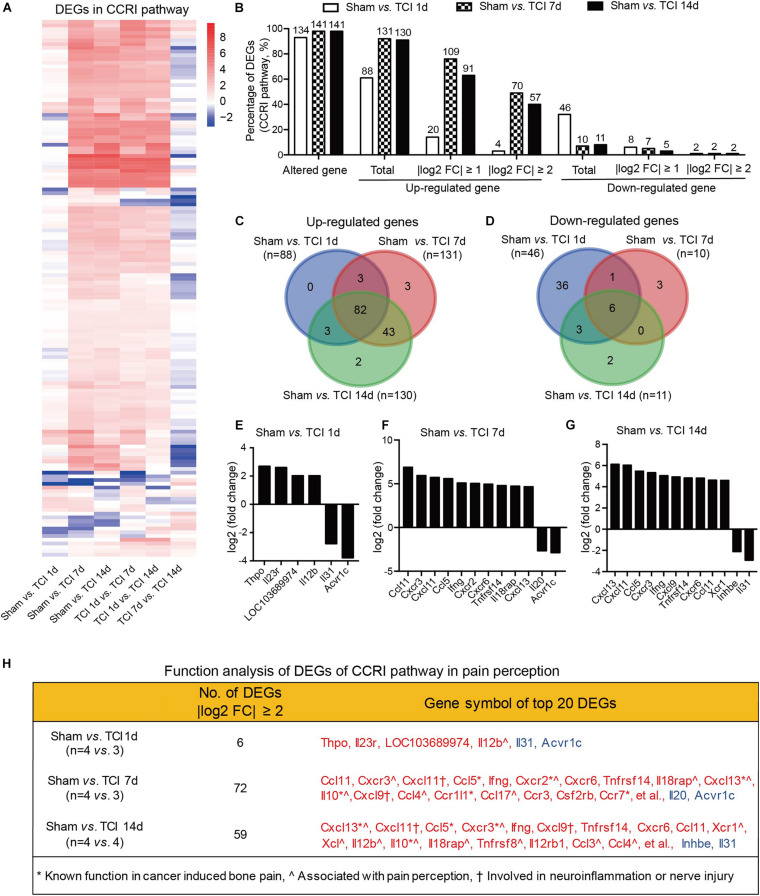
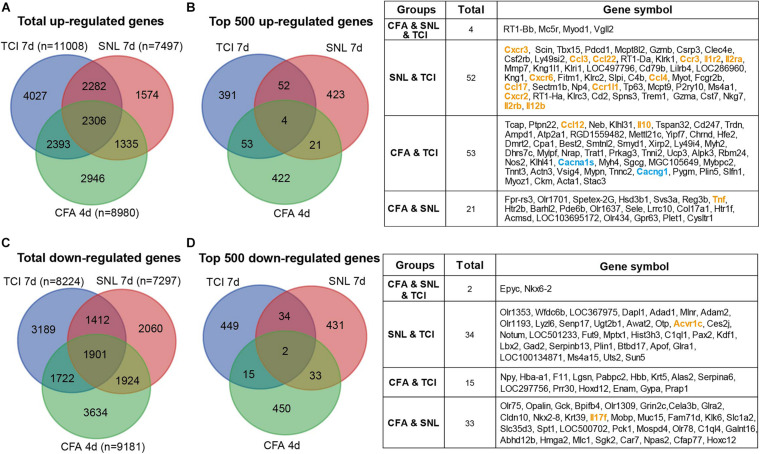
Cancer and cancer pain processes a major clinical challenge and the underlined mechanisms of pathogenesis remain elusive. We examined the specific changes in the transcriptomic profiles in the dorsal root ganglion (DRG) neurons of rats with bone cancer and bone cancer pain (BCP) using RNA sequencing technology. The bone cancer and BCP was induced by tumor cells implantation (TCI) into the tibia bone cavity in adult female rats. One week after treatment, TCI caused up- and down-regulation of thousands of genes in DRG. These genes were mainly involved in the immune process, inflammatory response, and intracellular signaling transduction of carbohydrate and cytokine. The cAMP and calcium signaling pathways were the major processes in the initial responses. Differentially expressed gene (DEG) analysis further showed that the genes for ion channels increased during day 1-7, while the genes for cytokine signaling pathways sustainedly increased during day 7-14 after TCI. The time courses of gene expression for ion channels and cytokines support their distinct roles in the early induction and late maintenance of BCP development. In addition, among the top 500 up- and down-regulated genes, 80-90% were unique for bone cancer pain as well as neuropathic and inflammatory pain, while less than 2% were shared among the three different forms of pain. This study reveals the uniqueness of mechanisms underlying bone cancer with pain, which is, to a large extent, differently from pain after acute inflammatory and nerve injury and provides novel potential targets of DEGs for bone cancer with pain.
Keywords: RNA-sequence; allodynia; cancer pain; cytokines; dorsal root ganglion; hyperalgesia; ion channels; neuropathic pain.
Copyright © 2021 Zhai, Yang, Lin, Zhu, Xu, Liao and Song.
Conflict of interest statement
The authors declare that the research was conducted in the absence of any commercial or financial relationships that could be construed as a potential conflict of interest.
Figures
Similar articles
-
cGMP and cGMP-dependent protein kinase I pathway in dorsal root ganglia contributes to bone cancer pain in rats.Spine (Phila Pa 1976). 2014 Sep 1;39(19):1533-41. doi: 10.1097/BRS.0000000000000456. Spine (Phila Pa 1976). 2014. PMID: 24921837
-
Involvement of hyperpolarization-activated, cyclic nucleotide-gated cation channels in dorsal root ganglion in neuropathic pain.Sheng Li Xue Bao. 2008 Oct 25;60(5):579-80. Sheng Li Xue Bao. 2008. PMID: 18958363
-
Activation of the cAMP-PKA signaling pathway in rat dorsal root ganglion and spinal cord contributes toward induction and maintenance of bone cancer pain.Behav Pharmacol. 2014 Aug;25(4):267-76. doi: 10.1097/FBP.0000000000000048. Behav Pharmacol. 2014. PMID: 24978483
-
[Contribution of primary sensory neurons and spinal glial cells to pathomechanisms of neuropathic pain].Brain Nerve. 2008 May;60(5):483-92. Brain Nerve. 2008. PMID: 18516970 Review. Japanese.
-
Cyclic nucleotide signaling in sensory neuron hyperexcitability and chronic pain after nerve injury.Neurobiol Pain. 2019 Mar 8;6:100028. doi: 10.1016/j.ynpai.2019.100028. eCollection 2019 Aug-Dec. Neurobiol Pain. 2019. PMID: 31223142 Free PMC article. Review.
Cited by
-
Transcriptomic analysis of differentially alternative splicing patterns in mice with inflammatory and neuropathic pain.Mol Pain. 2024 Jan-Dec;20:17448069241249455. doi: 10.1177/17448069241249455. Mol Pain. 2024. PMID: 38597175 Free PMC article.
-
Pain-Related Gene Solute Carrier Family 24 Member 3 Is a Prognostic Biomarker and Correlated with Immune Infiltrates in Cervical Squamous Cell Carcinoma and Endocervical Adenocarcinoma: A Study via Integrated Bioinformatics Analyses and Experimental Verification.Comput Math Methods Med. 2023 Feb 7;2023:4164232. doi: 10.1155/2023/4164232. eCollection 2023. Comput Math Methods Med. 2023. PMID: 36798148 Free PMC article.
-
Lactobacillus rhamnosus GG and butyrate supplementation in rats with bone cancer reduces mechanical allodynia and increases expression of μ-opioid receptor in the spinal cord.Front Mol Neurosci. 2023 Jun 14;16:1207911. doi: 10.3389/fnmol.2023.1207911. eCollection 2023. Front Mol Neurosci. 2023. PMID: 37389091 Free PMC article.
-
Evidence of the Involvement of Spinal EZH2 in the Development of Bone Cancer Pain in Rats.J Pain Res. 2021 Nov 23;14:3593-3600. doi: 10.2147/JPR.S331114. eCollection 2021. J Pain Res. 2021. PMID: 34849017 Free PMC article.
-
Pain, fatigue, and associated gene expressions over chemotherapy in patients with colorectal cancer.PLoS One. 2025 Jun 27;20(6):e0325849. doi: 10.1371/journal.pone.0325849. eCollection 2025. PLoS One. 2025. PMID: 40577278 Free PMC article.
References
-
- An K., Liu Q. Y., Wang T. T., Ni H. D., He Q. L., Yao M., et al. (2019). [Relationship between expression of high-mobility group box-1 and inflammatory cytokines in patients with bone cancer pain]. Zhonghua Yi Xue Za Zhi 99 1293–1297. - PubMed
-
- Apryani E., Ali U., Wang Z. Y., Wu H. Y., Mao X. F., Ahmad K. A., et al. (2020). The spinal microglial IL-10/beta-endorphin pathway accounts for cinobufagin-induced mechanical antiallodynia in bone cancer pain following activation of alpha7-nicotinic acetylcholine receptors. J. Neuroinflammation 17:75. - PMC - PubMed
LinkOut - more resources
Full Text Sources
Other Literature Sources
Molecular Biology Databases