

Notoginsenoside R1 Improves Cerebral Ischemia/Reperfusion Injury by Promoting Neurogenesis via the BDNF/Akt/CREB Pathway
- PMID: 34025400
- PMCID: PMC8138209
- DOI: 10.3389/fphar.2021.615998
Notoginsenoside R1 Improves Cerebral Ischemia/Reperfusion Injury by Promoting Neurogenesis via the BDNF/Akt/CREB Pathway
Abstract
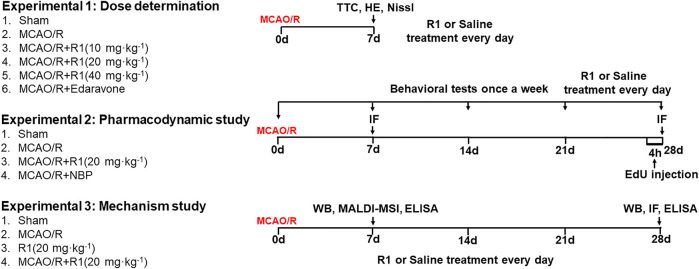
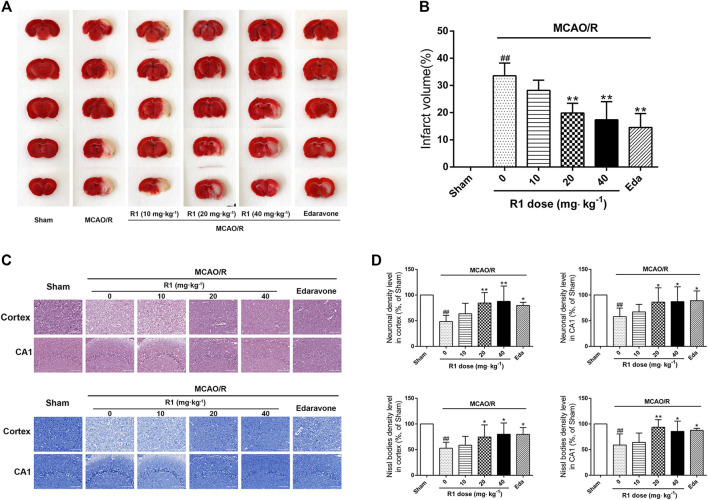
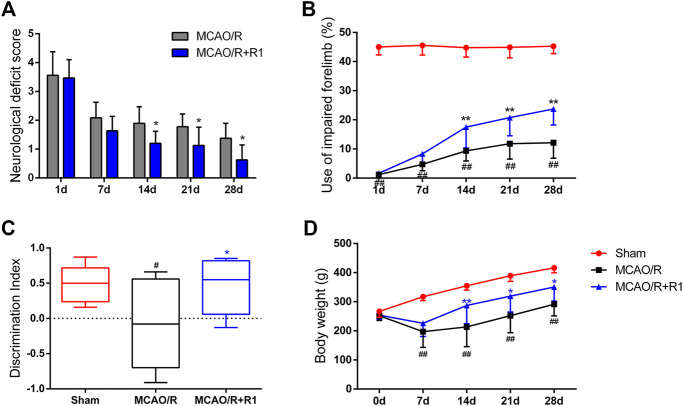
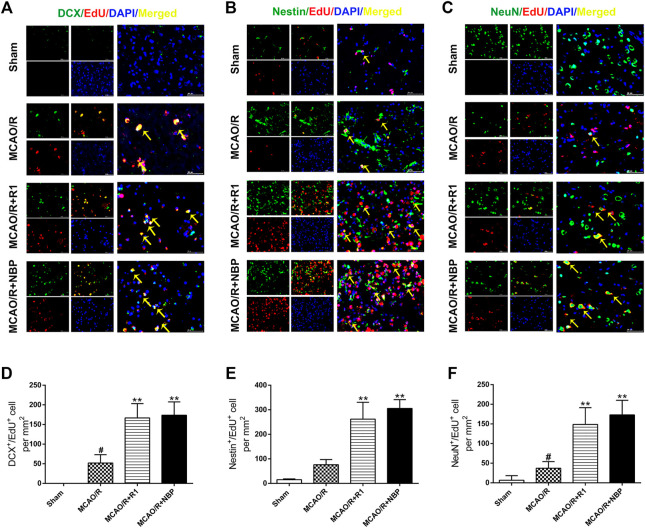
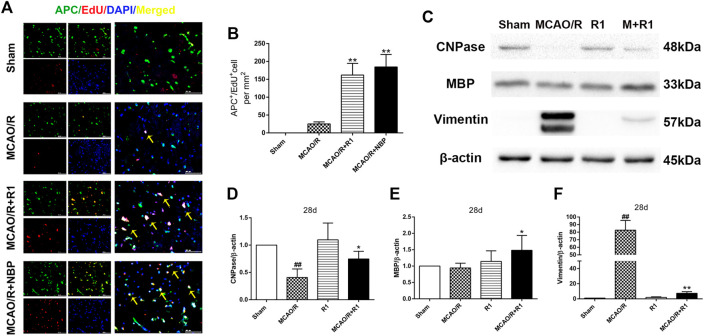
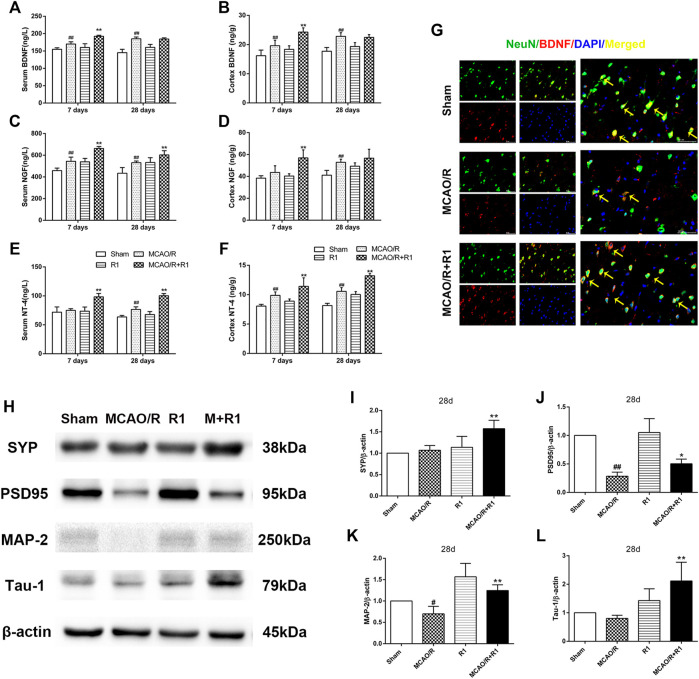
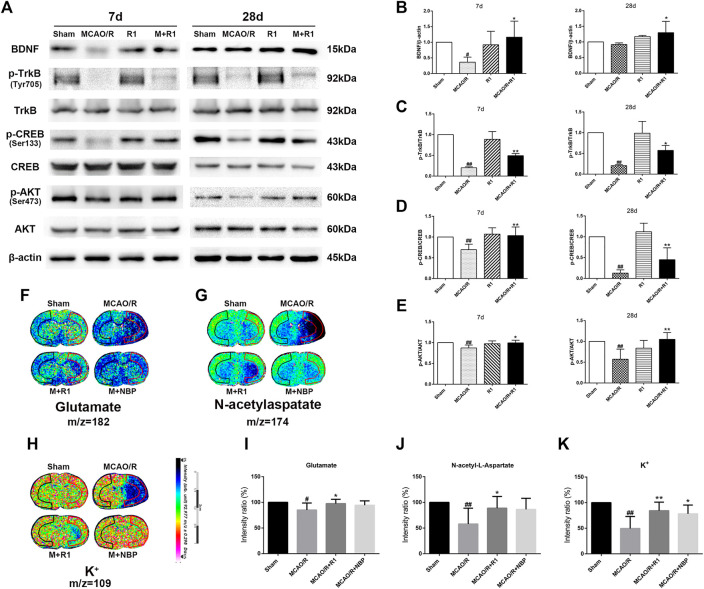
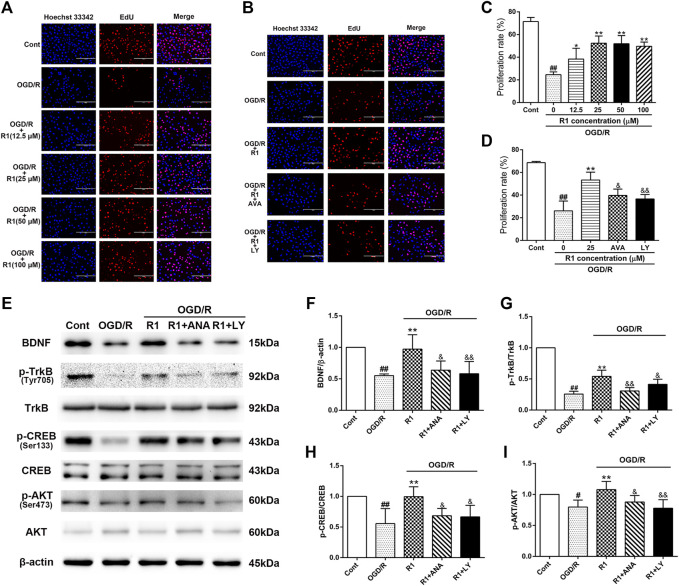
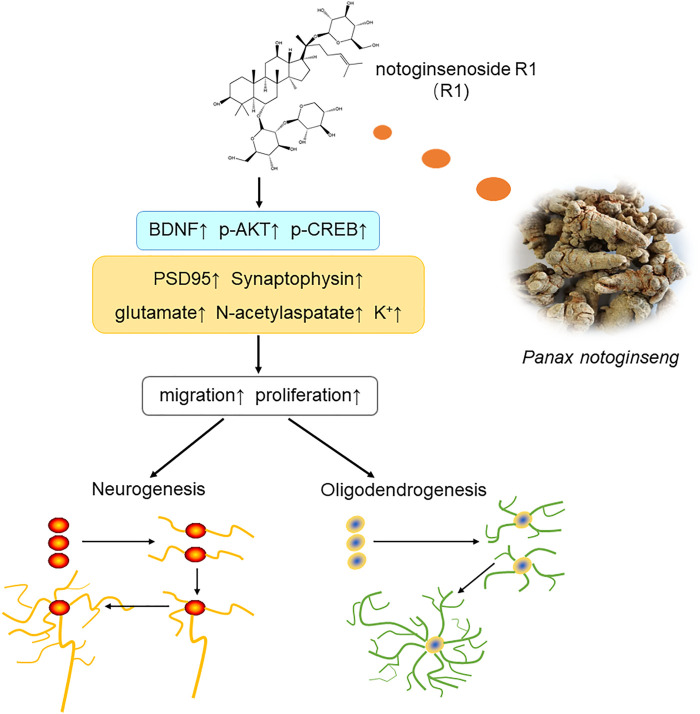
Notoginsenoside R1 (R1), a major component isolated from P. notoginseng, is a phytoestrogen that exerts many neuroprotective effects in a rat model of ischemic stroke. However, its long-term effects on neurogenesis and neurological restoration after ischemic stroke have not been investigated. The aim of this study was to evaluate the effects of R1 on neurogenesis and long-term functional recovery after ischemic stroke. We used male Sprague-Dawley rats subjected to middle cerebral artery occlusion/reperfusion (MCAO/R). R1 was administered by intraperitoneal (i.p.) injection immediately postischemia. We showed that R1 significantly decreased infarct volume and neuronal loss, restored neurological function, and stimulated neurogenesis and oligodendrogenesis in rats subjected to MCAO/R. More importantly, R1 promoted neuronal proliferation in PC12 cells in vitro. The proneurogenic effects of R1 were associated with the activation of Akt/cAMP responsive element-binding protein, as shown by the R1-induced increase in brain-derived neurotrophic factor (BDNF) expression, and with the activation of neurological function, which was partially eliminated by selective inhibitors of BDNF and PI3K. We demonstrated that R1 is a promising compound that exerts neuroprotective and proneurogenic effects, possibly via the activation of BDNF/Akt/CREB signaling. These findings offer insight into exploring new mechanisms in long-term functional recovery after R1 treatment of ischemic stroke.
Keywords: ischemic stroke; neurogenesis; neurological recovery; notoginsenoside R1; oligodendrogenesis.
Copyright © 2021 Zhu, Wang, Xie, Meng, Feng, Sun and Sun.
Conflict of interest statement
The authors declare that the research was conducted in the absence of any commercial or financial relationships that could be construed as a potential conflict of interest.
Figures
Similar articles
-
Danhong injection improves neurological function in rats with ischemic stroke by enhancing neurogenesis and activating BDNF/AKT/CREB signaling pathway.Biomed Pharmacother. 2023 Jul;163:114887. doi: 10.1016/j.biopha.2023.114887. Epub 2023 May 17. Biomed Pharmacother. 2023. PMID: 37207429
-
Notoginsenoside R1 activates the NAMPT-NAD+-SIRT1 cascade to promote postischemic angiogenesis by modulating Notch signaling.Biomed Pharmacother. 2021 Aug;140:111693. doi: 10.1016/j.biopha.2021.111693. Epub 2021 May 21. Biomed Pharmacother. 2021. PMID: 34029951
-
Tetramethylpyrazine nitrone activates the BDNF/Akt/CREB pathway to promote post-ischaemic neuroregeneration and recovery of neurological functions in rats.Br J Pharmacol. 2018 Feb;175(3):517-531. doi: 10.1111/bph.14102. Epub 2017 Dec 22. Br J Pharmacol. 2018. PMID: 29161771 Free PMC article.
-
Pharmacological properties and mechanisms of Notoginsenoside R1 in ischemia-reperfusion injury.Chin J Traumatol. 2023 Jan;26(1):20-26. doi: 10.1016/j.cjtee.2022.06.008. Epub 2022 Jul 3. Chin J Traumatol. 2023. PMID: 35922249 Free PMC article. Review.
-
Activation of endothelial ras-related C3 botulinum toxin substrate 1 (Rac1) improves post-stroke recovery and angiogenesis via activating Pak1 in mice.Exp Neurol. 2019 Dec;322:113059. doi: 10.1016/j.expneurol.2019.113059. Epub 2019 Sep 6. Exp Neurol. 2019. PMID: 31499064 Free PMC article. Review.
Cited by
-
Safranal acts as a neurorestorative agent in rats with cerebral ischemic stroke via upregulating SIRT1.Exp Ther Med. 2023 Dec 19;27(2):71. doi: 10.3892/etm.2023.12358. eCollection 2024 Feb. Exp Ther Med. 2023. PMID: 38234630 Free PMC article.
-
Notoginsenoside R1 attenuates brain injury in rats with traumatic brain injury: Possible mediation of apoptosis via ERK1/2 signaling pathway.PLoS One. 2023 Dec 18;18(12):e0295903. doi: 10.1371/journal.pone.0295903. eCollection 2023. PLoS One. 2023. PMID: 38109303 Free PMC article.
-
Preconditioned MSCs Alleviate Cerebral Ischemia-Reperfusion Injury in Rats by Improving the Neurological Function and the Inhibition of Apoptosis.Brain Sci. 2022 May 11;12(5):631. doi: 10.3390/brainsci12050631. Brain Sci. 2022. PMID: 35625017 Free PMC article.
-
Folium Ginkgo extract and tetramethylpyrazine sodium chloride injection (Xingxiong injection) protects against focal cerebral ischaemia/reperfusion injury via activating the Akt/Nrf2 pathway and inhibiting NLRP3 inflammasome activation.Pharm Biol. 2022 Dec;60(1):195-205. doi: 10.1080/13880209.2021.2014895. Pharm Biol. 2022. PMID: 35060427 Free PMC article.
-
Knowledge mapping of exosomes in ischemic stroke: a bibliometric analysis.Front Neurol. 2025 Jul 23;16:1595379. doi: 10.3389/fneur.2025.1595379. eCollection 2025. Front Neurol. 2025. PMID: 40771978 Free PMC article.
References
-
- Abg Abd Wahab D. Y., Gau C. H., Zakaria R., Muthu Karuppan M. K., A-rahbi B. S., Abdullah Z., et al. (2019). Review on Cross Talk between Neurotransmitters and Neuroinflammation in Striatum and Cerebellum in the Mediation of Motor Behaviour. Biomed. Res. Int. 2019, 1–10. 10.1155/2019/1767203 - DOI - PMC - PubMed
-
- Benraiss A., Chmielnicki E., Lerner K., Roh D., Goldman S. A. (2001). Adenoviral Brain-Derived Neurotrophic Factor Induces Both Neostriatal and Olfactory Neuronal Recruitment from Endogenous Progenitor Cells in the Adult Forebrain. J. Neurosci. 21 (17), 6718–6731. 10.1523/jneurosci.21-17-06718.2001 - DOI - PMC - PubMed
LinkOut - more resources
Full Text Sources
Other Literature Sources