Review
. 2021 May 6:12:671640.
doi: 10.3389/fphar.2021.671640. eCollection 2021.

Cellular Mechanisms of Liver Fibrosis

Affiliations
Review

Cellular Mechanisms of Liver Fibrosis

Pragyan Acharya et al. Front Pharmacol. .

Abstract

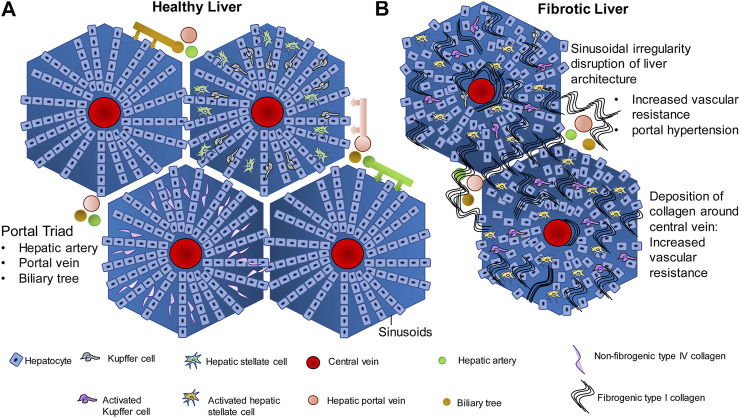
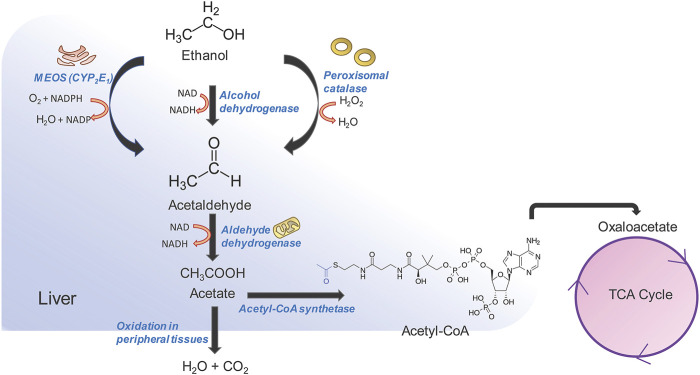
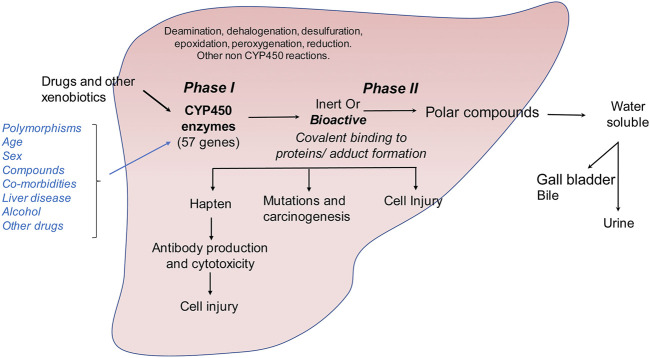
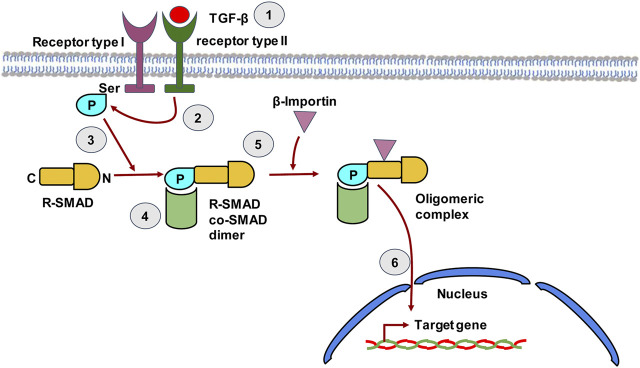
The liver is a central organ in the human body, coordinating several key metabolic roles. The structure of the liver which consists of the distinctive arrangement of hepatocytes, hepatic sinusoids, the hepatic artery, portal vein and the central vein, is critical for its function. Due to its unique position in the human body, the liver interacts with components of circulation targeted for the rest of the body and in the process, it is exposed to a vast array of external agents such as dietary metabolites and compounds absorbed through the intestine, including alcohol and drugs, as well as pathogens. Some of these agents may result in injury to the cellular components of liver leading to the activation of the natural wound healing response of the body or fibrogenesis. Long-term injury to liver cells and consistent activation of the fibrogenic response can lead to liver fibrosis such as that seen in chronic alcoholics or clinically obese individuals. Unidentified fibrosis can evolve into more severe consequences over a period of time such as cirrhosis and hepatocellular carcinoma. It is well recognized now that in addition to external agents, genetic predisposition also plays a role in the development of liver fibrosis. An improved understanding of the cellular pathways of fibrosis can illuminate our understanding of this process, and uncover potential therapeutic targets. Here we summarized recent aspects in the understanding of relevant pathways, cellular and molecular drivers of hepatic fibrosis and discuss how this knowledge impact the therapy of respective disease.

Keywords: NASH; alcohol; chemokines; cholestasis; cytokines; drugs; liver fibrosis; therapy.


Conflict of interest statement

The authors declare that the research was conducted in the absence of any commercial or financial relationships that could be construed as a potential conflict of interest.

Figures

FIGURE 1
FIGURE 1
Liver architecture in healthy liver and fibrosis. (A) In normal liver, hepatocytes are arranged in rows radiating outwards from the central vein, toward the edge of the lobule. The gaps between the hepatocyte rows are known as sinusoids which are lined with endothelial cells, and contain Kupffer cells, hepatic stellate cells, and contain extracellular material such as the non fibrogenic type IV collagen. Hepatic portal vein, hepatic artery and biliary tree are the three major vessels feeding into the sinusoids and the exchange of blood gases, nutrients and other signaling molecules occurs in the sinusoids. (B) Injury to hepatocytes due to any of several causes such as alcohol, drug, genetic predisposition, etc., activates the wound healing fibrogenic response. Chronic injury to the hepatocytes and chronic activation of the fibrogenic pathway in the liver leads to synthesis of fibrogenic type I collagen by the Hepatic stellate cells and its deposition within the sinusoids. Deposition around the central vein and around the portal vein leads to increase in vascular resistance and portal hypertension. Compensatory mechanisms such as esophageal varices and ascites follow.
FIGURE 2
FIGURE 2
Alcohol metabolism in the liver. Three pathways are involved in alcohol metabolism and all of them converge on the oxidation of ethanol to acetaldehyde. Acetaldehyde is further converted to acetate by aldehyde dehydrogenase in the mitochondria. Acetate can be rapidly oxidized into CO2 and H2O by peripheral tissues, or can be diverted to the tri-carboxylic acid (TCA) pathway. The oxidation of ethanol to acetaldehyde by microsomal ethanol oxidation system (MEOS) occurs in the smooth endoplasmic reticulum and changes the NADPH/NADP ratio which in turn influences the regeneration of glutathione thereby increasing cellular oxidative stress. The alcohol dehydrogenase pathway is the major pathway and occurs in the cytosol, generating large amounts of NADH. NADH in turn inhibits TCA cycle enzymes and leads to accumulation of acetyl CoA and increase in ketone body generation and acidosis. NADH also inhibits fatty acid oxidation leading to accumulation of fats and causing “fatty liver.” A combination of the above factors leads to tissue injury and activation of the fibrogenic pathway.
FIGURE 3
FIGURE 3
Metabolism of drugs and other xenobiotics in the liver. Drug and xenobiotic metabolism occurs in two phases: (i) phase I is catalyzed by the cytochrome P450 family of monooxygenases which metabolize ingested small molecules to form inert or bioactive metabolic intermediates. (ii) These intermediates are further catalyzed in phase II reactions to form soluble polar compounds that can be further excreted through urine or bile. Accumulation of bioactive drug or xenobiotic intermediates can lead to the formation of protein or nucleic acid adducts causing autoimmune reaction, carcinogenesis or direct cellular injury.
FIGURE 4
FIGURE 4
The TGF-β signaling pathway in hepatic stellate cells. TGF-β binds to type II TGF-β receptor leading to receptor dimerization i.e. recruitment of the type I TGF-β receptor. The kinase domain of Type II TGF-β receptor then phosphorylates the Ser residue of type I TGF-β receptor. The phosphorylated receptor now recruits R-SMAD, which binds to receptor through its N-terminal region and gets phosphorylated by the Type II receptor. The C-terminal of R-SMAD has a DNA binding domain (DBD) that can act as a transcription factor. The co-SMAD now binds to R-SMAD and β-Importin binds to the dimer forming an oligomeric complex that guides the R-SMAD and Co-SMAD into the nucleus. The dimer enters the nucleus and the DBD of SMAD now acts as transcription factor that can transcribe target genes.
FIGURE 5
FIGURE 5
Summary of pathways that may be important in the progression of NAFLD to NASH. The transition from healthy to NAFLD involves the activation of peroxisome proliferator activated receptor signaling, insulin signaling and p53 signaling whereas the switch to NASH involves activation of inflammatory pathways such as TLR and NOD like receptor mediated signaling, generation of intracellular oxidative stress and mitochondrial signaling.
FIGURE 6
FIGURE 6
Potential sources of extracellular matrix (ECM) producing cells in liver fibrosis. ECM producing cells during hepatic fibrosis can originate from many sources. Hepatic stellate cells (HSCs) that transdifferenatiate into myofibroblasts (MFBs), activated portal myofibroblasts and activated resident fibroblasts are rich sources of ECM. In addition, several other cell types that become activated, infiltrate the liver, or originate by diverse transition processes are suitable to express large quantities of ECM. Major pathways driving establishment of myofibrogenic features are indicated for each progenitor. Abbreviations used are: ECM, extracellular matrix; EGF, epithelial growth factor; EMT, epithelial-to-mesenchymal transition; FGF1/2, fibroblast growth factor 1/2; GLI1, glioma-associated oncogene homolog 1; HGF, hepatocyte growth factor; IGF-1, insulin growth factor-1; IL, interleukin; MMT, mesothelial-to-mesenchymal transition; PDGF, platelet-derived growth factor; TGF-α/β, transforming growth factor-α/β; VEGF, vascular endothelial growth factor. For details see text.
FIGURE 7
FIGURE 7
Expression of fibrogenic markers in liver. The figure was compiled using immunohistochemical data from the Human Protein Atlas (www.proteinatlas.org/) (Uhlén et al., 2015). α-smooth muscle actin (α-SMA) and collagen type 1α1 (COL1A1) proteins were stained in normal and diseased livers.
FIGURE 8
FIGURE 8
Additional markers of hepatic stellate cells and portal myofibroblasts. The figure was compiled from data deposited from Human Protein Atlas (www.proteinatlas.org/) (Uhlén et al., 2015). Immunohistochemistry of the cysteine and glycine rich protein 2 (CRP2), Fibulin 2, nerve growth factor receptor (NGFR), platelet-derived growth factor-β (PDGFRβ) and Vimentin in normal and diseased liver tissue. Liver damage is associated with increased expression of these profibrogenic markers. Image credit: Human Protein Atlas.
FIGURE 9
FIGURE 9
Crystal structure of the five Zn fingers from human GLI1 in complex with a high-affinity DNA binding site. Shown is a complex of a peptide derived from the human GLI1 oncoprotein spanning region Glu 234 to Gly388 with a DNA fragment containing the specific binding site 5′-GACCACCCA-3′ (underlined). Each of the five zinc fingers has a conserved sequence motif that is characterized by the consensus sequence X3-Cys-X2-4-Cys-X12-His-X3-5-His-X4 (where X is any acid residue). The structure has been determined at 2.6 Å resolution. Structure coordinates were taken from the PDB Protein Data Bank (access. no. 2GLI). For details see (Pavletich and Pabo 1993).
FIGURE 10
FIGURE 10
Expression of GLI1 in human bone osteocarcoma cell line U-2 OS. The cell line U-2 OS originating from human mesenchymal tumors express large quantities of GLI1 (green), which is localized in the nucleus and the cytoplasm. Microtubuli (red) and nucleus (blue) are stained by a specific antibody or DAPI. The figure was compiled using immunocytochemical data taken from the Human Protein Atlas v.20 (www.proteinatlas.org/) (Uhlén et al., 2015). They can be found at: https://www.proteinatlas.org/ENSG00000111087-GLI1/cell#img.
FIGURE 11
FIGURE 11
GLI1 expression in liver (A) single cell PCR data shows that GLI1 mRNA expression in normal human liver is rather low (<1 protein-coding transcript per million) and majorly restricted to a subpopulation of T-cells, B-cells and hepatocytes (B) Heatmap of marker gene expression in different hepatic cell types. The figure was compiled using expression data from the Human Protein Atlas (www.proteinatlas.org/) (Uhlén et al., 2015). Abbreviations used are: pTPM, protein-coding transcript per million; UMAP, uniform manifold approximation and projection.
FIGURE 12
FIGURE 12
Potential therapeutic options for liver fibrosis. Based on the fact that hepatic fibrosis is driven by different mediators and pathways, there is a plenitude of possibilities to interfere with this process. For more details see text or refer to (Schon et al., 2016; Weiskirchen 2016; Tacke and Weiskirchen, 2018; Weiskirchen et al., 2018; Levada et al., 2019).

References

    1. Acharya P., Garg M., Kumar P., Munjal A., Raja K. D. (2017). Host-Parasite Interactions in Human Malaria: Clinical Implications of Basic Research. Front. Microbiol. 8, 889. 10.3389/fmicb.2017.00889 - DOI - PMC - PubMed
    1. Amanatidou A. I., Dedoussis G. V. (2021). Bioinformatics Analysis of the NAFLD Interactome: Revealing Candidate Biomarkers of Non-alcoholic Fatty Liver Disease. Comput. Biol. Med. 131. 104243. 10.1101/2020.12.01.406215 - DOI - PubMed
    1. Ambade A., Lowe P., Kodys K., Catalano D., Gyongyosi B., Cho Y., et al. (2019). Pharmacological Inhibition of CCR2/5 Signaling Prevents and Reverses Alcohol-Induced Liver Damage, Steatosis, and Inflammation in Mice. Hepatology 69 (3), 1105–1121. 10.1002/hep.30249 - DOI - PMC - PubMed
    1. Andrade Z. A., Guerret S., Fernandes A. L. (1999). Myofibroblasts in Schistosomal Portal Fibrosis of Man. Mem. Inst. Oswaldo Cruz 94 (1), 87–93. 10.1590/s0074-02761999000100018 - DOI - PubMed
    1. Andrade Z. A. (2004). Schistosomal Hepatopathy. Mem. Inst. Oswaldo Cruz 99 (5 Suppl. 1), 51–57. 10.1590/s0074-02762004000900009 - DOI - PubMed

LinkOut - more resources