. 2021 May 5:12:682987.
doi: 10.3389/fphar.2021.682987. eCollection 2021.

Multidirectional Effects of Tormentil Extract on Hemostasis in Experimental Diabetes

Affiliations

Multidirectional Effects of Tormentil Extract on Hemostasis in Experimental Diabetes

Natalia Marcinczyk et al. Front Pharmacol. .

Abstract

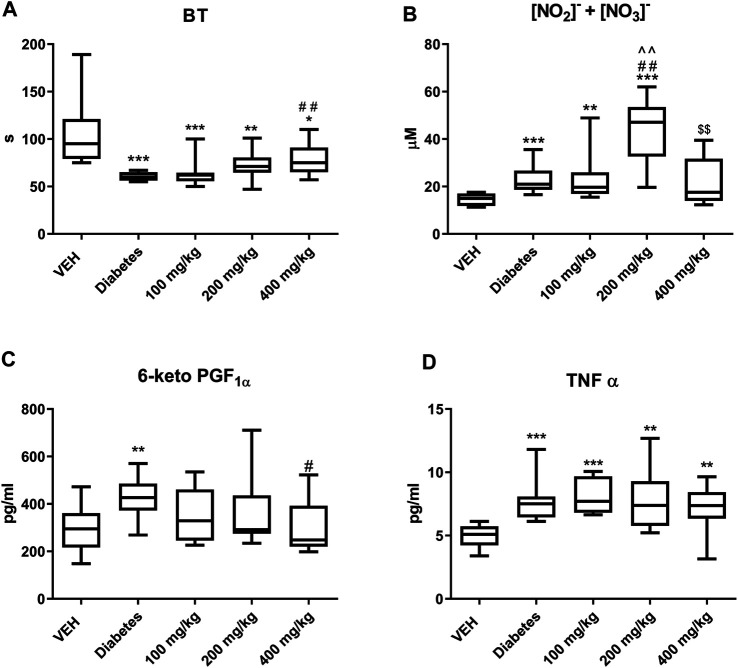
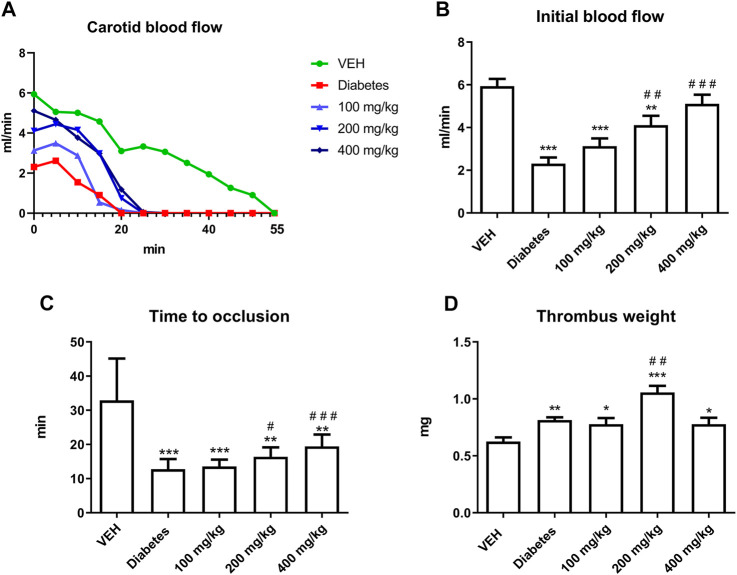
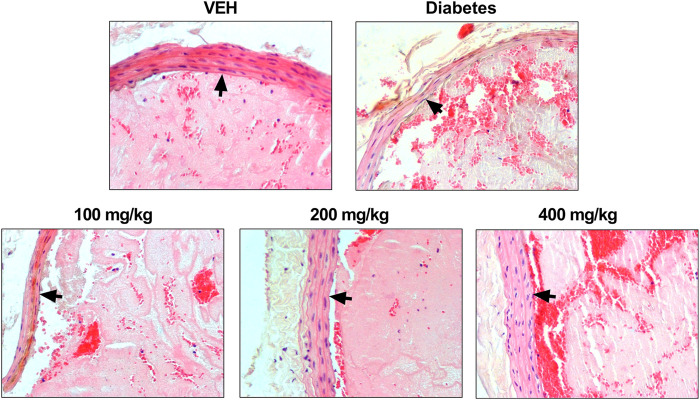
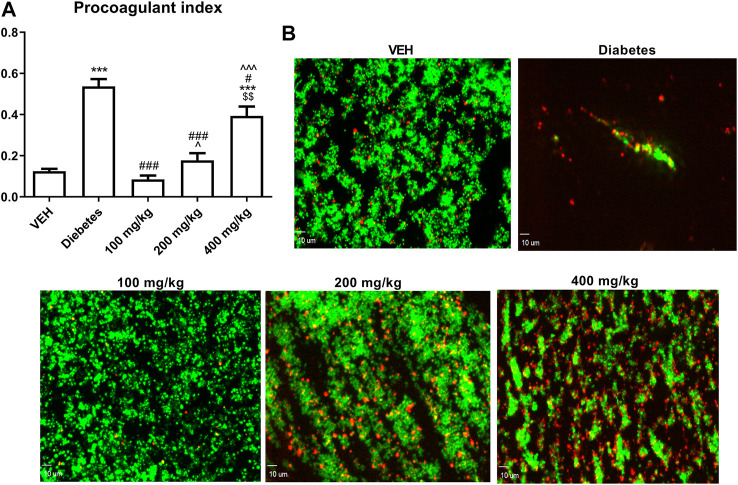
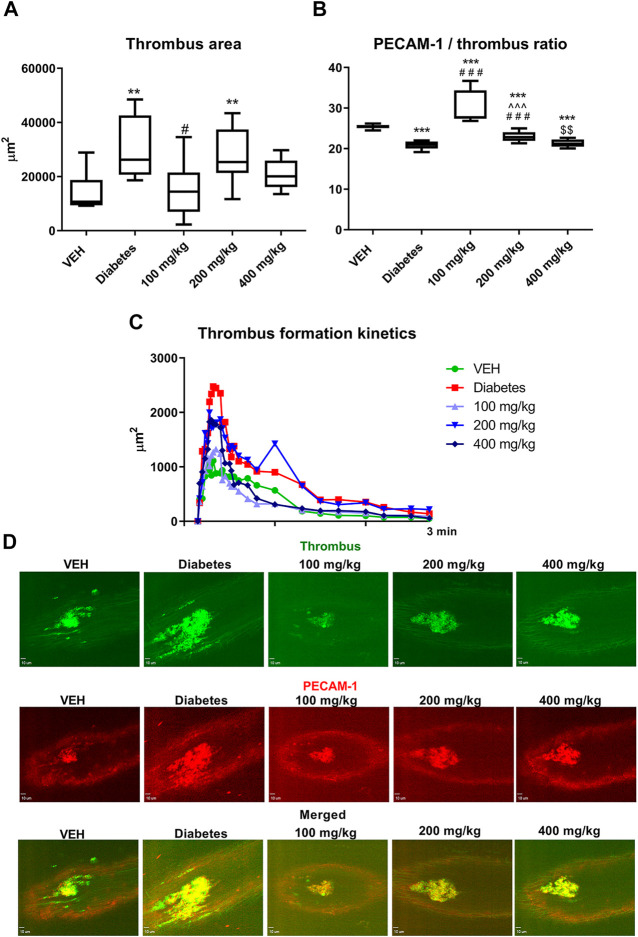
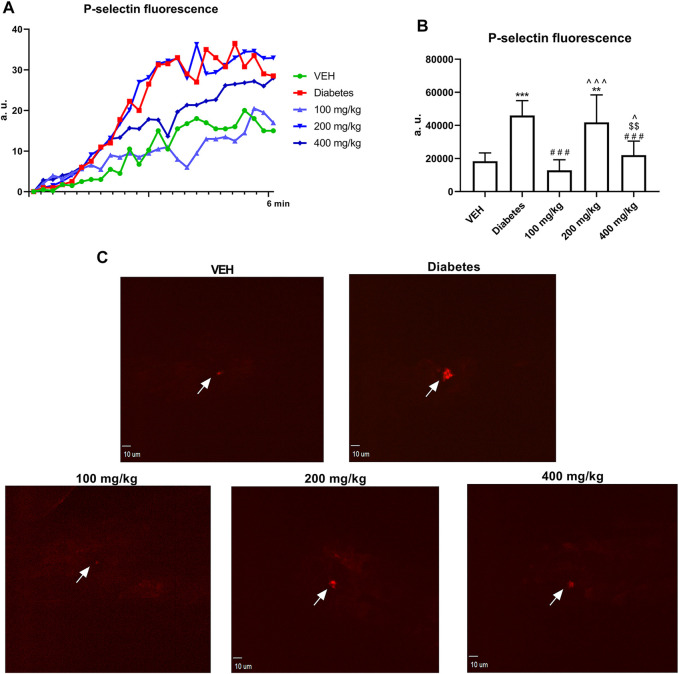
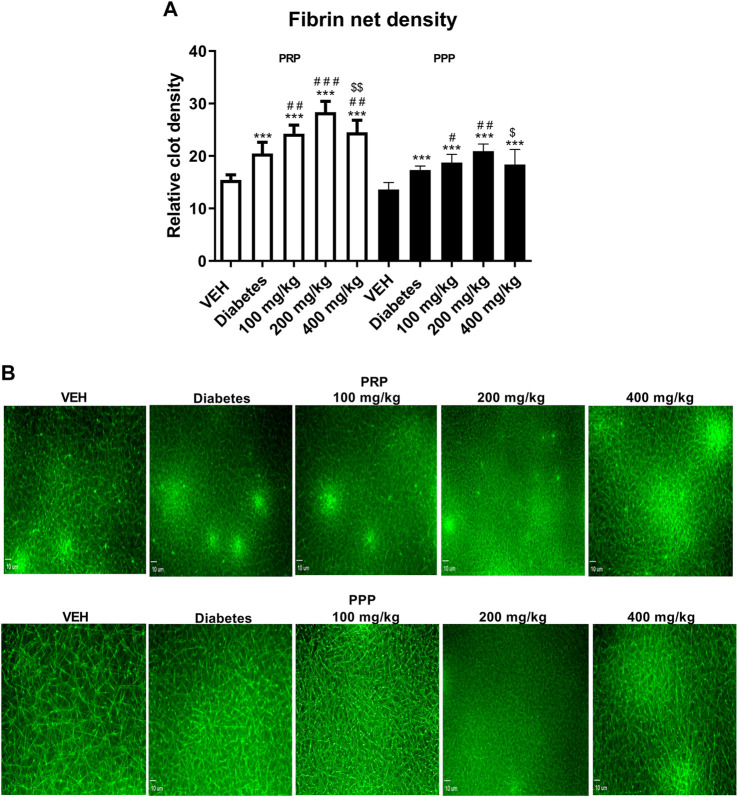
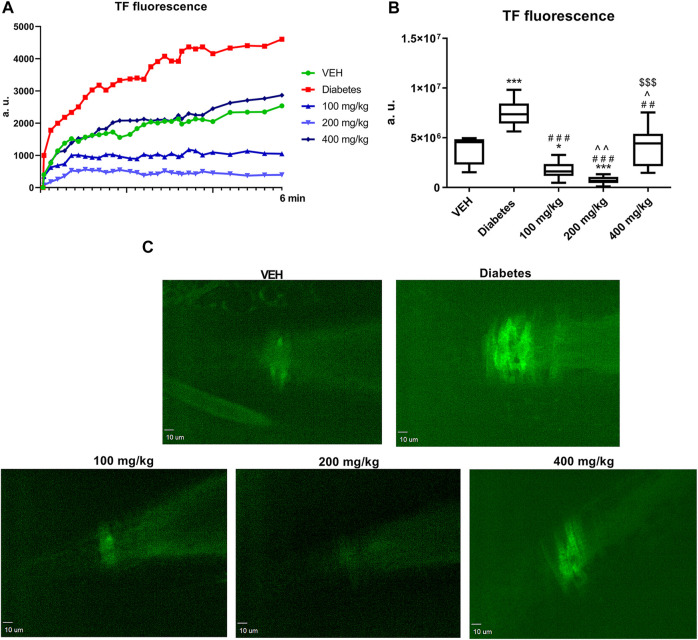
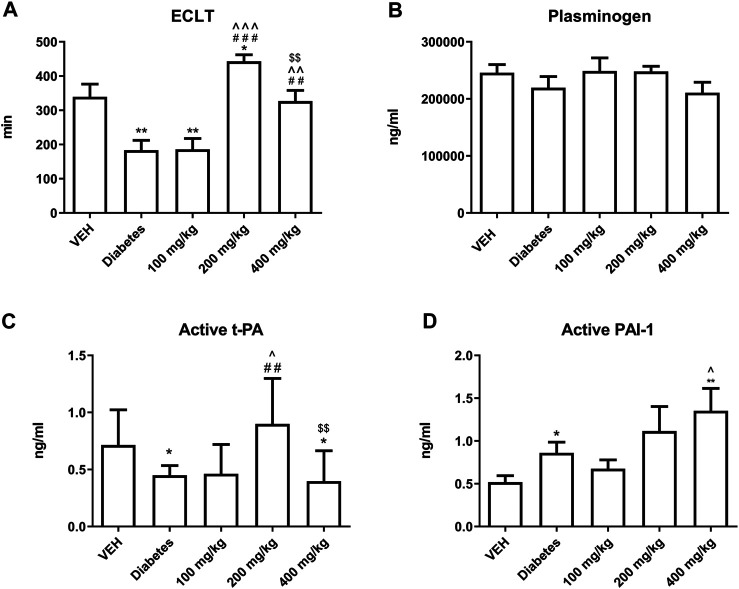
In our previous study, we showed that ellagitannin- and procyanidin-rich tormentil extract (TE) decreased experimental arterial thrombosis in normoglycemic rats through platelet inhibition. TE also slightly increased coagulation and attenuated fibrinolysis; however, these effects did not nullify the antithrombotic effect of TE. The present study aimed to assess whether TE exerts antithrombotic activity in streptozotocin (STZ)-induced diabetes, which is characterized by pre-existing increased coagulation and impaired fibrinolysis, in vivo and ex vivo thrombosis assays. TE (100, 200, or 400 mg/kg, p. o.) was administered for 14 days to STZ-induced diabetic rats and mice. TE at 100 mg/kg dose decreased the thrombus area in the mice model of laser-induced thrombosis through its potent antiplatelet effect. However, TE at 200 mg/kg dose increased thrombus weight in electrically induced arterial thrombosis in rats. The prothrombotic effect could be due to increased coagulation and attenuated fibrinolysis. TE at 400 mg/kg dose also improved vascular functions, which was mainly reflected as an increase in the arterial blood flow, bleeding time prolongation, and thickening of the arterial wall. However, TE at 400 mg/kg dose did not exert antithrombotic effect. Summarizing, the present results show that TE may exert multidirectional effects on hemostasis in STZ-induced diabetic rats and mice. TE inhibited platelet activity and improved endothelial functions, but it also showed unfavorable effects by increasing the activity of the coagulation system and by inhibiting fibrinolysis. These contrasting effects could be the reason for model-specific influence of TE on the thrombotic process in STZ-induced diabetes.

Keywords: Potentilla erecta; STZ-induced diabetes; ellagitannins; hemostasis; thrombosis.


Conflict of interest statement

The authors declare that the research was conducted in the absence of any commercial or financial relationships that could be construed as a potential conflict of interest.

Figures

FIGURE 1
FIGURE 1
The effect of TE on: BT (A), concentration of NO2 and NO3 (B), concentration of 6-keto PGF (C), concentration of TNF-α (D). *p < 0.05, **p < 0.01, ***p < 0.001 vs. VEH; #p < 0.05, ##p < 0.01 vs. Diabetes; ^^p < 0.01 vs. 100 mg/kg; $$p < 0.01 vs. 200 mg/kg; n = 8–11. Data are shown as median (interquartile range).
FIGURE 2
FIGURE 2
The effect of TE on electrically induced thrombosis. Changes in the carotid blood flow in the artery of rats subjected to electrical stimulation (A). The effect of TE on: IBF in the rat artery before electrical stimulation (B), TTO in the rat artery (C), dry thrombus weight (D). *p < 0.05, **p < 0.01, ***p < 0.001 vs. VEH; #p < 0.05, ##p < 0.01, ###p < 0.001 vs. Diabetes; n = 8–11. Data are shown as mean ± SEM.
FIGURE 3
FIGURE 3
Representative photomicrographs of the thrombi and rat carotid artery wall. Fibrin and platelet aggregates are stained pink, erythrocytes are stained red, leukocytes are stained blue, and black arrows indicate the arterial wall. Routine H and E staining, ×200 magnification.
FIGURE 4
FIGURE 4
The effect of TE on PI (A). Representative confocal microscopy images of thrombus consisting of PS-negative platelets (green) and PS-positive platelets (red). Bar = 10 µm (B) ***p < 0.001 vs. VEH; #p < 0.05, ###p < 0.001 vs. Diabetes; ^p < 0.05,^^^p < 0.001 vs. 100 mg/kg; $$p < 0.01 vs. 200 mg/kg; n = 8–11. Data are shown as mean ± SEM.
FIGURE 5
FIGURE 5
The effect of TE on laser-induced thrombosis. The effect of TE on: thrombus area (A) and PECAM-1/thrombus ratio (B). Kinetics of thrombus formation at the site of laser injury (C). Representative confocal microscopy images of thrombus (green, top row), PECAM-1 (red, middle row), and merged channels (bottom row). Bar = 10 µm (D). **p < 0.01, ***p < 0.001 vs. VEH; #p < 0.05, ###p < 0.001 vs. Diabetes; ^^^p < 0.001 vs. 100 mg/kg; $$p < 0.01 vs. 200 mg/kg; n = 7–10. Data are shown as median (interquartile range).
FIGURE 6
FIGURE 6
Changes in P-selectin fluorescence at the site of injury. Fluorescence of P-selectin is presented in arbitrary units of fluorescence (a. u.) (A). The effect of TE on P-selectin secretion by platelets (B). Representative confocal microscopy images of P-selectin. White arrows indicate the site of injury. Bar = 10 µm (C). **p < 0.01, ***p < 0.001 vs. VEH; ###p < 0.001 vs. Diabetes; ^p < 0.05, ^^^p < 0.001 vs. 100 mg/kg; $$p < 0.01 vs. 200 mg/kg, n = 8–9. Data are shown as mean ± SEM.
FIGURE 7
FIGURE 7
The effect of TE on the fibrin net density in clots formed after recalcination of PRP (white bars) and PPP (black bars) (A). Representative confocal microscopy images of fibrin net. Bar = 10 µm (B). ***p < 0.001 vs. VEH; #p < 0.05, ##p < 0.01, ###p < 0.001 vs. Diabetes; $p < 0.05, $$p < 0.01 vs. 200 mg/kg; n = 7–9. Data are shown as mean ± SEM.
FIGURE 8
FIGURE 8
Changes in TF fluorescence at the site of injury over time. Fluorescence of TF is presented in arbitrary units of fluorescence (a. u.) (A). The effect of TE on TF expression (B). Representative confocal microscopy images of TF expression. Bar = 10 µm (C). *p < 0.05, ***p < 0.001 vs. VEH; ##p < 0.01, ###p < 0.001 vs. Diabetes; ^p < 0.05, ^^p < 0.01 vs. 100 mg/kg; $$$p < 0.001 vs. 200 mg/kg; n = 7–9. Data are shown as median (interquartile range).
FIGURE 9
FIGURE 9
The effect of TE on fibrinolysis. The effect of TE on: ECLT (A), plasminogen concentration (B), concentration of active form of t-PA (C), concentration of active form of PAI-1 (D). *p < 0.05, **p < 0.01 vs. VEH; ##p < 0.01, ###p < 0.001 vs. Diabetes; ^p < 0.05, ^^p < 0.01, ^^^p < 0.001 vs. 100 mg/kg; $$p < 0.01 vs. 200 mg/kg; n = 7–11. Data are shown as mean ± SEM.

References

    1. Augustynowicz D., Latté K. P., Tomczyk M. (2021). Recent Phytochemical and Pharmacological Advances in the Genus Potentilla L. Sensu Lato - an Update Covering the Period from 2009 to 2020. J. Ethnopharmacology 266, 113412. 10.1016/j.jep.2020.113412 - DOI - PubMed
    1. Basu P., Sen U., Tyagi N., Tyagi S. C. (2010). Blood Flow Interplays with Elastin: Collagen and MMP: TIMP Ratios to Maintain Healthy Vascular Structure and Function. Vasc. Health Risk Manag. 6, 215–228. 10.2147/VHRM.S9472 - DOI - PMC - PubMed
    1. Bouaziz A., Romera-Castillo C., Salido S., Linares-Palomino P. J., Altarejos J., Bartegi A., et al. (2007). Cinnamtannin B-1 from Bay Wood Exhibits Antiapoptotic Effects in Human Platelets. Apoptosis 12, 489–498. 10.1007/s10495-006-0014-z - DOI - PubMed
    1. Byun M.-W. (2012). Effect of Procyanidin C1 on Nitric Oxide Production and Hyperpolarization Through Ca2+-Dependent Pathway in Endothelial Cells. J. Med. Food 15, 1032–1037. 10.1089/jmf.2012.2297 - DOI - PubMed
    1. Chandler W. L., Levy W. C., Stratton J. R. (1995). The Circulatory Regulation of TPA and UPA Secretion, Clearance, and Inhibition During Exercise and During the Infusion of Isoproterenol and Phenylephrine. Circulation 92, 2984–2994. 10.1161/01.CIR.92.10.2984 - DOI - PubMed

LinkOut - more resources