. 2021 May 5:12:677581.
doi: 10.3389/fphys.2021.677581. eCollection 2021.

The Effectiveness of Post-exercise Stretching in Short-Term and Delayed Recovery of Strength, Range of Motion and Delayed Onset Muscle Soreness: A Systematic Review and Meta-Analysis of Randomized Controlled Trials

Affiliations

The Effectiveness of Post-exercise Stretching in Short-Term and Delayed Recovery of Strength, Range of Motion and Delayed Onset Muscle Soreness: A Systematic Review and Meta-Analysis of Randomized Controlled Trials

José Afonso et al. Front Physiol. .

Abstract

Background: Post-exercise (i.e., cool-down) stretching is commonly prescribed for improving recovery of strength and range of motion (ROM) and diminishing delayed onset muscular soreness (DOMS) after physical exertion. However, the question remains if post-exercise stretching is better for recovery than other post-exercise modalities. Objective: To provide a systematic review and meta-analysis of supervised randomized-controlled trials (RCTs) on the effects of post-exercise stretching on short-term (≤1 h after exercise) and delayed (e.g., ≥24 h) recovery makers (i.e., DOMS, strength, ROM) in comparison with passive recovery or alternative recovery methods (e.g., low-intensity cycling). Methods: This systematic review followed PRISMA guidelines (PROSPERO CRD42020222091). RCTs published in any language or date were eligible, according to P.I.C.O.S. criteria. Searches were performed in eight databases. Risk of bias was assessed using Cochrane RoB 2. Meta-analyses used the inverse variance random-effects model. GRADE was used to assess the methodological quality of the studies. Results: From 17,050 records retrieved, 11 RCTs were included for qualitative analyses and 10 for meta-analysis (n = 229 participants; 17-38 years, mostly males). The exercise protocols varied between studies (e.g., cycling, strength training). Post-exercise stretching included static stretching, passive stretching, and proprioceptive neuromuscular facilitation. Passive recovery (i.e., rest) was used as comparator in eight studies, with additional recovery protocols including low intensity cycling or running, massage, and cold-water immersion. Risk of bias was high in ~70% of the studies. Between-group comparisons showed no effect of post-exercise stretching on strength recovery (ES = -0.08; 95% CI = -0.54-0.39; p = 0.750; I 2 = 0.0%; Egger's test p = 0.531) when compared to passive recovery. In addition, no effect of post-exercise stretching on 24, 48, or 72-h post-exercise DOMS was noted when compared to passive recovery (ES = -0.09 to -0.24; 95% CI = -0.70-0.28; p = 0.187-629; I 2 = 0.0%; Egger's test p = 0.165-0.880). Conclusion: There wasn't sufficient statistical evidence to reject the null hypothesis that stretching and passive recovery have equivalent influence on recovery. Data is scarce, heterogeneous, and confidence in cumulative evidence is very low. Future research should address the limitations highlighted in our review, to allow for more informed recommendations. For now, evidence-based recommendations on whether post-exercise stretching should be applied for the purposes of recovery should be avoided, as the (insufficient) data that is available does not support related claims. Systematic Review Registration: PROSPERO, identifier: CRD42020222091.

Keywords: articular range of motion; cool-down; delayed onset muscular soreness; flexibility; muscle stretching exercises; myalgia; post exercise recovery; stretching.


Conflict of interest statement

The authors declare that the research was conducted in the absence of any commercial or financial relationships that could be construed as a potential conflict of interest.

Figures
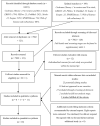
Figure 1
Figure 1
Flowchart describing the study selection process.
Figure 2
Figure 2
Percentage distribution of risk of bias in individual studies (RoB 2).
Figure 3
Figure 3
Forest plot denoting short-term strength recovery level in participants that completed post-exercise stretching protocols. Values shown are effect sizes (Hedges's g) with 95% confidence intervals (CI). The size of the plotted squares reflects the statistical weight of each study. The black diamond reflects the overall result. Note: negative values denote that post-exercise stretching protocols did not allow participants to recover their basal strength level (i.e., 0.00 in the figure).
Figure 4
Figure 4
Forest plot denoting short-term strength recovery level in participants that completed post-exercise passive recovery protocols. Values shown are effect sizes (Hedges's g) with 95% confidence intervals (CI). The size of the plotted squares reflects the statistical weight of each study. The black diamond reflects the overall result. Note: negative values denote that post-exercise passive recovery protocols did not allow participants to recover their basal strength level (i.e., 0.00 in the figure).
Figure 5
Figure 5
Forest plot of changes in short-term strength recovery after participating in post-exercise stretching protocols compared to control conditions (i.e., passive recovery). Values shown are effect sizes (Hedges's g) with 95% confidence intervals (CI). The size of the plotted squares reflects the statistical weight of each study. The black diamond reflects the overall result.
Figure 6
Figure 6
Forest plot denoting 24-h post-exercise delayed onset of muscle soreness (DOMS) in participants that completed post-exercise stretching protocols. Values shown are effect sizes (Hedges's g) with 95% confidence intervals (CI). The size of the plotted squares reflects the statistical weight of each study. The black diamond reflects the overall result. Note: positive values denote that post-exercise stretching protocols did not allow participants to recover their basal DOMS level (i.e., 0.00 in the figure).
Figure 7
Figure 7
Forest plot denoting 24-h post-exercise delayed onset of muscle soreness (DOMS) in participants that completed passive recovery (control conditions) protocols. Values shown are effect sizes (Hedges's g) with 95% confidence intervals (CI). The size of the plotted squares reflects the statistical weight of each study. The black diamond reflects the overall result. Note: positive values denote that passive recovery protocols did not allow participants to recover their basal DOMS level (i.e., 0.00 in the figure).
Figure 8
Figure 8
Forest plot of changes in 24-h post-exercise delayed onset of muscle soreness (DOMS) after participating in post-exercise stretching protocols compared to control conditions (i.e., passive recovery). Values shown are effect sizes (Hedges's g) with 95% confidence intervals (CI). The size of the plotted squares reflects the statistical weight of each study. The black diamond reflects the overall result.
Figure 9
Figure 9
Forest plot denoting 48-h post-exercise delayed onset of muscle soreness (DOMS) in participants that completed post-exercise stretching protocols. Values shown are effect sizes (Hedges's g) with 95% confidence intervals (CI). The size of the plotted squares reflects the statistical weight of each study. The black diamond reflects the overall result. Note: positive values denote that post-exercise stretching protocols did not allow participants to recover their basal DOMS level (i.e., 0.00 in the figure).
Figure 10
Figure 10
Forest plot denoting 48-h post-exercise delayed onset of muscle soreness (DOMS) in participants that completed post-exercise passive recovery. Values shown are effect sizes (Hedges's g) with 95% confidence intervals (CI). The size of the plotted squares reflects the statistical weight of each study. The black diamond reflects the overall result. Note: positive values denote that post-exercise passive recovery did not allow participants to recover their basal DOMS level (i.e., 0.00 in the figure).
Figure 11
Figure 11
Forest plot of changes in 48-h post-exercise delayed onset of muscle soreness (DOMS) after participating in post-exercise stretching protocols compared to control conditions (i.e., passive recovery). Values shown are effect sizes (Hedges's g) with 95% confidence intervals (CI). The size of the plotted squares reflects the statistical weight of each study. The black diamond reflects the overall result.
Figure 12
Figure 12
Forest plot denoting 72-h post-exercise delayed onset of muscle soreness (DOMS) in participants that completed post-exercise stretching protocols. Values shown are effect sizes (Hedges's g) with 95% confidence intervals (CI). The size of the plotted squares reflects the statistical weight of each study. The black diamond reflects the overall result. Note: positive values denote that post-exercise stretching protocols did not allow participants to recover their basal DOMS level (i.e., 0.00 in the figure).
Figure 13
Figure 13
Forest plot denoting 72-h post-exercise delayed onset of muscle soreness (DOMS) in participants that completed post-exercise passive recovery protocols. Values shown are effect sizes (Hedges's g) with 95% confidence intervals (CI). The size of the plotted squares reflects the statistical weight of each study. The black diamond reflects the overall result. Note: positive values denote that post-exercise passive recovery protocols did not allow participants to recover their basal DOMS level (i.e., 0.00 in the figure).
Figure 14
Figure 14
Forest plot of changes in 72-h post-exercise delayed onset of muscle soreness (DOMS) after participating in post-exercise stretching protocols compared to control conditions (i.e., passive recovery). Values shown are effect sizes (Hedges's g) with 95% confidence intervals (CI). The size of the plotted squares reflects the statistical weight of each study. The black diamond reflects the overall result.

References

    1. Abt G., Boreham C., Davison G., Jackson R., Nevill A., Wallace E., et al. . (2020). Power, precision, and sample size estimation in sport and exercise science research. J. Sports Sci. 38, 1933–1935. 10.1080/02640414.2020.1776002 - DOI - PubMed
    1. ACSM (2018). ACSM's Guidelines for Exercise Testing and Prescription, 10th Edn., eds Bayles M. P., Swank A. M.. Philadelphia, PA: Wolters Kluwer.
    1. American Heart Association (2020). Guidelines and Statements. Available online at: https://professional.heart.org/en/guidelines-and-statements/guidelines-a...
    1. Apostolopoulos N. C., Lahart I. M., Plyley M. J., Taunton J., Nevill A. M., Koutedakis Y., et al. . (2018). The effects of different passive static stretching intensities on recovery from unaccustomed eccentric exercise – a randomized controlled trial. Appl. Physiol. Nutr. Metab. 43, 806–815. 10.1139/apnm-2017-0841 - DOI - PubMed
    1. Bonfim A. E. D., De Re D., Gaffuri J., Costa M. M. D., Portolez J. L. M., Bertolini G. R. F. (2010). Use of static stretching as an intervenient factor in delayed onset muscle soreness. Rev. Brasil. De Med. Do Esporte 16, 349–352. 10.1590/S1517-86922010000500006 - DOI

Publication types

LinkOut - more resources