

Berberine Slows the Progression of Prediabetes to Diabetes in Zucker Diabetic Fatty Rats by Enhancing Intestinal Secretion of Glucagon-Like Peptide-2 and Improving the Gut Microbiota
- PMID: 34025574
- PMCID: PMC8138858
- DOI: 10.3389/fendo.2021.609134
Berberine Slows the Progression of Prediabetes to Diabetes in Zucker Diabetic Fatty Rats by Enhancing Intestinal Secretion of Glucagon-Like Peptide-2 and Improving the Gut Microbiota
Abstract
Background: Berberine is a plant alkaloid that has multiple beneficial effects against intestine inflammation. In our previous study, we have found that berberine also possesses an antidiabetic effect. However, whether berberine is useful in the prevention of type 2 diabetes mellitus (T2DM) through its effect on intestine endocrine function and gut microbiota is unclear.
Aim: To investigate the effects of berberine in the prevention of T2DM, as well as its effects on intestine GLP-2 secretion and gut microbiota in ZDF rats.
Methods: Twenty Zucker Diabetic Fatty (ZDF) rats were fed a high-energy diet until they exhibited impaired glucose tolerance (IGT). The rats were then divided into two groups to receive berberine (100 mg/kg/d; berberine group) or vehicle (IGT group) by gavage for 3 weeks. Five Zucker Lean (ZL) rats were used as controls. Fasting blood glucose (FBG) was measured, an oral glucose tolerance test was performed, and the Homeostatic Model Assessment of Insulin Resistance (HOMA-IR) was calculated. Intestinal expression of TLR-4, NF-κB, TNF-α, mucin, zona occludens-1 (ZO-1) and occludin were assessed (immunohistochemistry). Plasma levels and glutamine-induced intestinal secretion of glucagon-like peptide-1 (GLP-1) and GLP-2 were measured (enzyme-linked immunosorbent assay). The plasma lipopolysaccharide (LPS) level was measured. Fecal DNA extraction, pyrosequencing, and bioinformatics analysis were performed.
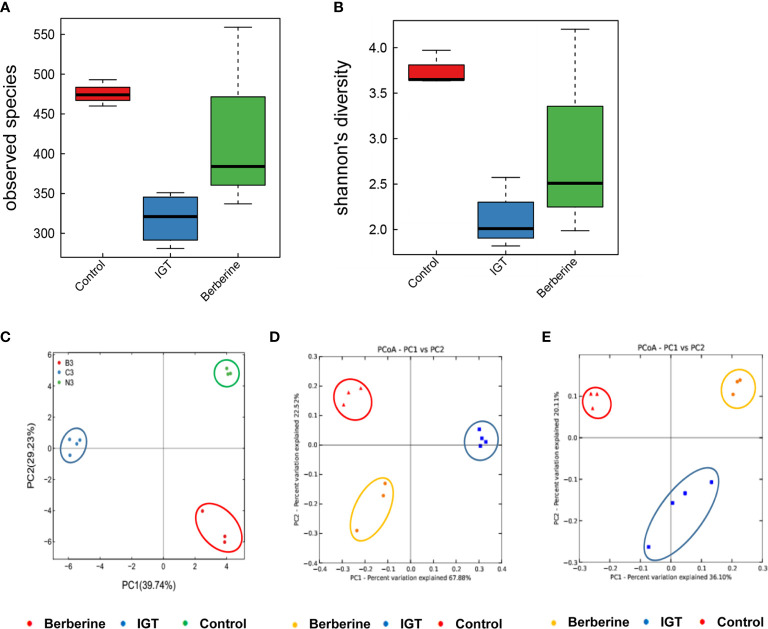
Results: After 3 weeks of intervention, diabetes developed in all rats in the IGT group, but only 30% of rats in the berberine group. Treatment with berberine was associated with reductions in food intake, FBG level, insulin resistance, and plasma LPS level, as well as increases in fasting plasma GLP-2 level and glutamine-induced intestinal GLP-2 secretion. Berberine could increase the goblet cell number and villi length, and also reverse the suppressed expressions of mucin, occludin, ZO-1 and the upregulated expressions of TLR-4, NF-κB and TNF-α induced in IGT rats (P<0.05). Berberine also improved the structure of the gut microbiota and restored species diversity.
Conclusion: Berberine may slow the progression of prediabetes to T2DM in ZDF rats by improving GLP-2 secretion, intestinal permeability, and the structure of the gut microbiota.
Keywords: berberine; glucagon-like peptide-2; intestinal microbiota; intestinal permeability; type 2 diabetes mellitus.
Copyright © 2021 Wang, Liu, Zheng, Yang, Ren, Kong, Wang, Wang, Jiang, Yang and Shan.
Conflict of interest statement
The authors declare that the research was conducted in the absence of any commercial or financial relationships that could be construed as a potential conflict of interest.
Figures


Similar articles
-
Cocoa diet modulates gut microbiota composition and improves intestinal health in Zucker diabetic rats.Food Res Int. 2020 Jun;132:109058. doi: 10.1016/j.foodres.2020.109058. Epub 2020 Feb 1. Food Res Int. 2020. PMID: 32331673
-
Effect of 1-Deoxynojirimycin on insulin resistance in prediabetic mice based on next-generation sequencing and intestinal microbiota study.J Ethnopharmacol. 2022 May 10;289:115029. doi: 10.1016/j.jep.2022.115029. Epub 2022 Jan 22. J Ethnopharmacol. 2022. PMID: 35077826
-
Effects of berberine and metformin on intestinal inflammation and gut microbiome composition in db/db mice.Biomed Pharmacother. 2019 Oct;118:109131. doi: 10.1016/j.biopha.2019.109131. Epub 2019 Aug 27. Biomed Pharmacother. 2019. PMID: 31545226
-
Berberine-induced glucagon-like peptide-1 and its mechanism for controlling type 2 diabetes mellitus: a comprehensive pathway review.Arch Physiol Biochem. 2024 Dec;130(6):678-685. doi: 10.1080/13813455.2023.2258559. Epub 2023 Nov 3. Arch Physiol Biochem. 2024. PMID: 37921026 Review.
-
Probiotics, prebiotics, synbiotics and insulin sensitivity.Nutr Res Rev. 2018 Jun;31(1):35-51. doi: 10.1017/S095442241700018X. Epub 2017 Oct 17. Nutr Res Rev. 2018. PMID: 29037268 Review.
Cited by
-
Plant-Derived Compounds as Promising Therapeutics for Vitiligo.Front Pharmacol. 2021 Nov 11;12:685116. doi: 10.3389/fphar.2021.685116. eCollection 2021. Front Pharmacol. 2021. PMID: 34858164 Free PMC article. Review.
-
Molecular Effects of Chronic Exposure to Palmitate in Intestinal Organoids: A New Model to Study Obesity and Diabetes.Int J Mol Sci. 2022 Jul 13;23(14):7751. doi: 10.3390/ijms23147751. Int J Mol Sci. 2022. PMID: 35887100 Free PMC article.
-
The role of berberine in Covid-19: potential adjunct therapy.Inflammopharmacology. 2022 Dec;30(6):2003-2016. doi: 10.1007/s10787-022-01080-1. Epub 2022 Oct 2. Inflammopharmacology. 2022. PMID: 36183284 Free PMC article. Review.
-
Microorganism-regulated autophagy in gastrointestinal cancer.PeerJ. 2023 Sep 27;11:e16130. doi: 10.7717/peerj.16130. eCollection 2023. PeerJ. 2023. PMID: 37786582 Free PMC article.
-
Huanglian-Renshen-Decoction Maintains Islet β-Cell Identity in T2DM Mice through Regulating GLP-1 and GLP-1R in Both Islet and Intestine.Chin J Integr Med. 2025 Jan;31(1):39-48. doi: 10.1007/s11655-024-3915-1. Epub 2024 Nov 18. Chin J Integr Med. 2025. PMID: 39551849
References
Publication types
MeSH terms
Substances
LinkOut - more resources
Full Text Sources
Other Literature Sources
Medical