

Deep Soil Layers of Drought-Exposed Forests Harbor Poorly Known Bacterial and Fungal Communities
- PMID: 34025630
- PMCID: PMC8137989
- DOI: 10.3389/fmicb.2021.674160
Deep Soil Layers of Drought-Exposed Forests Harbor Poorly Known Bacterial and Fungal Communities
Abstract
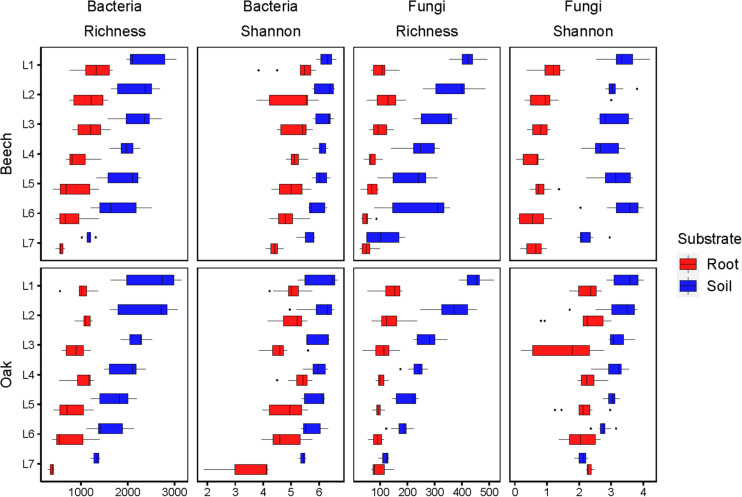
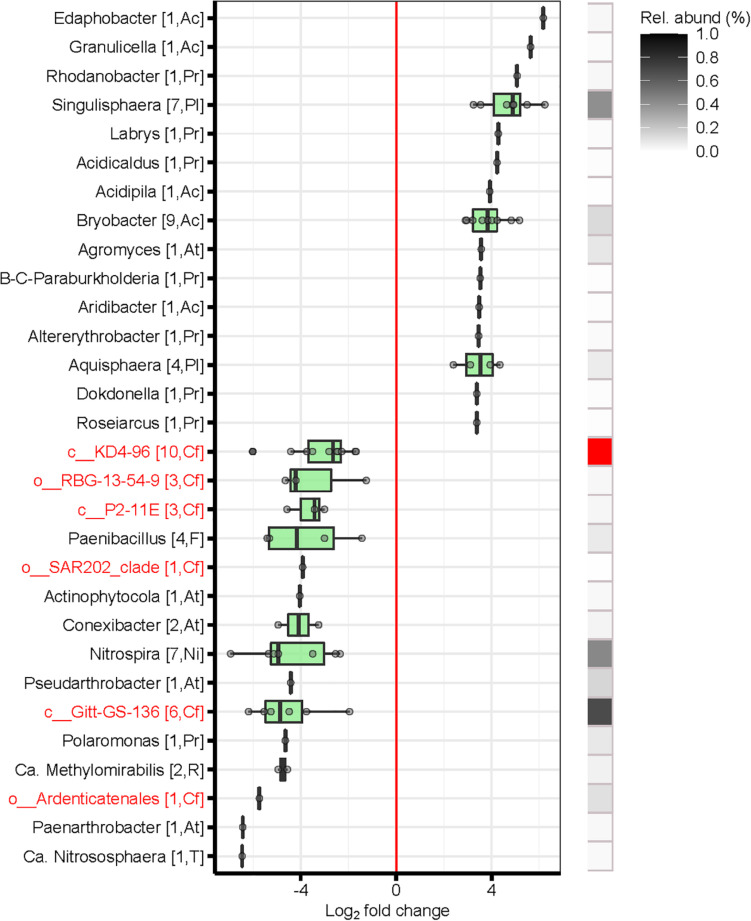
Soil microorganisms such as bacteria and fungi play important roles in the biogeochemical cycling of soil nutrients, because they act as decomposers or are mutualistic or antagonistic symbionts, thereby influencing plant growth and health. In the present study, we investigated the vertical distribution of the soil microbiome to a depth of 2 m in Swiss drought-exposed forests of European beech and oaks on calcareous bedrock. We aimed to disentangle the effects of soil depth, tree (beech, oak), and substrate (soil, roots) on microbial abundance, diversity, and community structure. With increasing soil depth, organic carbon, nitrogen, and clay content decreased significantly. Similarly, fine root biomass, microbial biomass (DNA content, fungal abundance), and microbial alpha-diversity decreased and were consequently significantly related to these physicochemical parameters. In contrast, bacterial abundance tended to increase with soil depth, and the bacteria to fungi ratio increased significantly with greater depth. Tree species was only significantly related to the fungal Shannon index but not to the bacterial Shannon index. Microbial community analyses revealed that bacterial and fungal communities varied significantly across the soil layers, more strongly for bacteria than for fungi. Both communities were also significantly affected by tree species and substrate. In deep soil layers, poorly known bacterial taxa from Nitrospirae, Chloroflexi, Rokubacteria, Gemmatimonadetes, Firmicutes and GAL 15 were overrepresented. Furthermore, archaeal phyla such as Thaumarchaeota and Euryarchaeota were more abundant in subsoils than topsoils. Fungal taxa that were predominantly found in deep soil layers belong to the ectomycorrhizal Boletus luridus and Hydnum vesterholtii. Both taxa are reported for the first time in such deep soil layers. Saprotrophic fungal taxa predominantly recorded in deep soil layers were unknown species of Xylaria. Finally, our results show that the microbial community structure found in fine roots was well represented in the bulk soil. Overall, we recorded poorly known bacterial and archaeal phyla, as well as ectomycorrhizal fungi that were not previously known to colonize deep soil layers. Our study contributes to an integrated perspective on the vertical distribution of the soil microbiome at a fine spatial scale in drought-exposed forests.
Keywords: FUNGuild; Fagus sylvatica; Illumina MiSeq sequencing; Quercus spp.; bacterial and fungal communities; deep forest soil layers; drought.
Copyright © 2021 Frey, Walthert, Perez-Mon, Stierli, Köchli, Dharmarajah and Brunner.
Conflict of interest statement
The authors declare that the research was conducted in the absence of any commercial or financial relationships that could be construed as a potential conflict of interest.
Figures


Similar articles
-
Shotgun Metagenomics of Deep Forest Soil Layers Show Evidence of Altered Microbial Genetic Potential for Biogeochemical Cycling.Front Microbiol. 2022 Mar 1;13:828977. doi: 10.3389/fmicb.2022.828977. eCollection 2022. Front Microbiol. 2022. PMID: 35300488 Free PMC article.
-
High Fungal Diversity but Low Seasonal Dynamics and Ectomycorrhizal Abundance in a Mountain Beech Forest.Microb Ecol. 2021 Jul;82(1):243-256. doi: 10.1007/s00248-021-01736-5. Epub 2021 Mar 23. Microb Ecol. 2021. PMID: 33755773 Free PMC article.
-
Fine Spatial Scale Variation of Soil Microbial Communities under European Beech and Norway Spruce.Front Microbiol. 2016 Dec 22;7:2067. doi: 10.3389/fmicb.2016.02067. eCollection 2016. Front Microbiol. 2016. PMID: 28066384 Free PMC article.
-
Truffle Microbiome Is Driven by Fruit Body Compartmentalization Rather than Soils Conditioned by Different Host Trees.mSphere. 2021 Aug 25;6(4):e0003921. doi: 10.1128/mSphere.00039-21. Epub 2021 Aug 11. mSphere. 2021. PMID: 34378984 Free PMC article.
-
Trends in Microbial Community Composition and Function by Soil Depth.Microorganisms. 2022 Feb 28;10(3):540. doi: 10.3390/microorganisms10030540. Microorganisms. 2022. PMID: 35336115 Free PMC article. Review.
Cited by
-
The heterogeneity of Pinus yunnanensis plantation growth was driven by soil microbial characteristics in different slope aspects.BMC Plant Biol. 2025 Jan 27;25(1):114. doi: 10.1186/s12870-025-06152-2. BMC Plant Biol. 2025. PMID: 39865278 Free PMC article.
-
Influence of Different Vegetation Types on Soil Physicochemical Parameters and Fungal Communities.Microorganisms. 2022 Apr 16;10(4):829. doi: 10.3390/microorganisms10040829. Microorganisms. 2022. PMID: 35456878 Free PMC article.
-
Soil, rhizosphere, and root microbiome in kiwifruit vine decline, an emerging multifactorial disease.Front Microbiol. 2024 Mar 21;15:1330865. doi: 10.3389/fmicb.2024.1330865. eCollection 2024. Front Microbiol. 2024. PMID: 38577679 Free PMC article.
-
Unveiling the hidden culturable endophytic fungal diversity in aerial vegetative parts of Wrightia tinctoria (Roxb.) R.Br. of southern Aravalli hills.Sci Rep. 2025 Aug 11;15(1):29378. doi: 10.1038/s41598-025-10980-5. Sci Rep. 2025. PMID: 40790312 Free PMC article.
-
Metabolic niches in the rhizosphere microbiome: dependence on soil horizons, root traits and climate variables in forest ecosystems.Front Plant Sci. 2024 Apr 5;15:1344205. doi: 10.3389/fpls.2024.1344205. eCollection 2024. Front Plant Sci. 2024. PMID: 38645395 Free PMC article. Review.
References
-
- Adamczyk M., Perez-Mon C., Gunz S., Frey B. (2020). Strong shifts in microbial community structure are associated with increased litter input rather than temperature in High Arctic soils. Soil Biol. Biochem. 151:108054. 10.1016/j.soilbio.2020.108054 - DOI
LinkOut - more resources
Full Text Sources
Other Literature Sources
Miscellaneous