. 2021 May 6:12:642585.
doi: 10.3389/fimmu.2021.642585. eCollection 2021.

Attenuated T Cell Responses Are Associated With the Blockade of Cerebral Malaria Development by YOP1-Deficient Plasmodium berghei ANKA

Affiliations

Attenuated T Cell Responses Are Associated With the Blockade of Cerebral Malaria Development by YOP1-Deficient Plasmodium berghei ANKA

Lei Hai et al. Front Immunol. .

Abstract

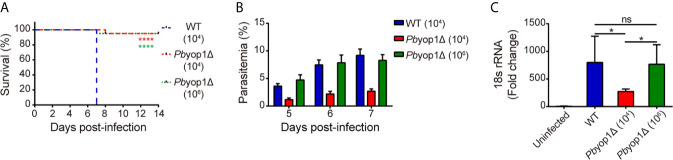
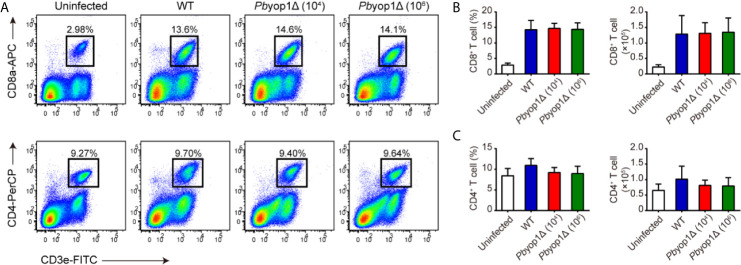
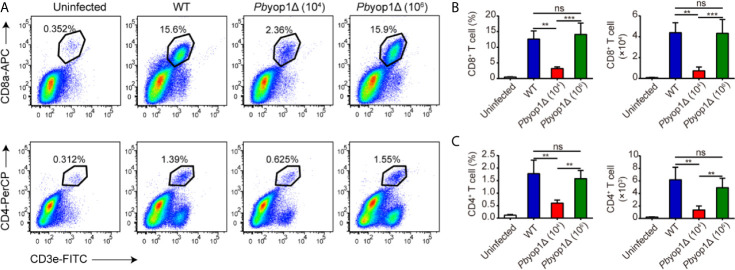
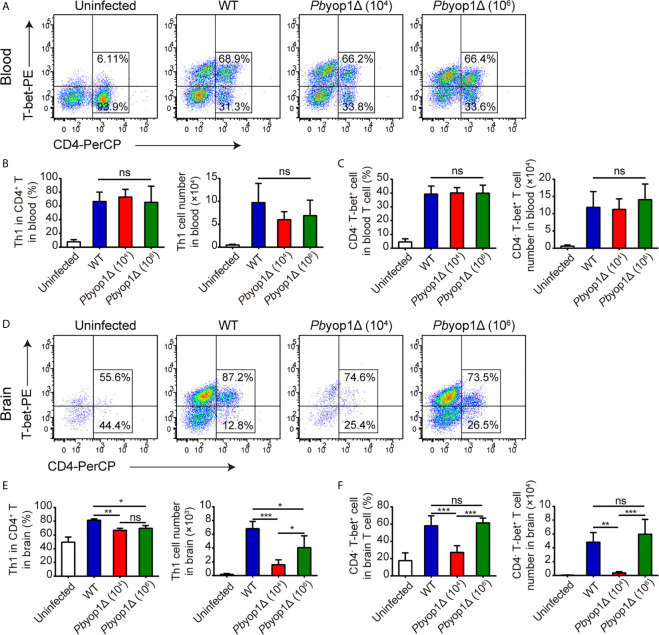
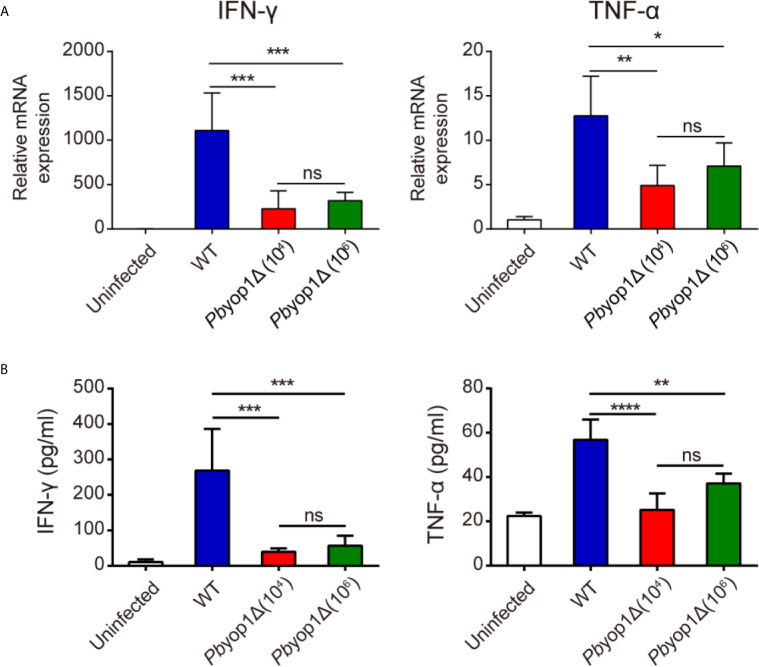
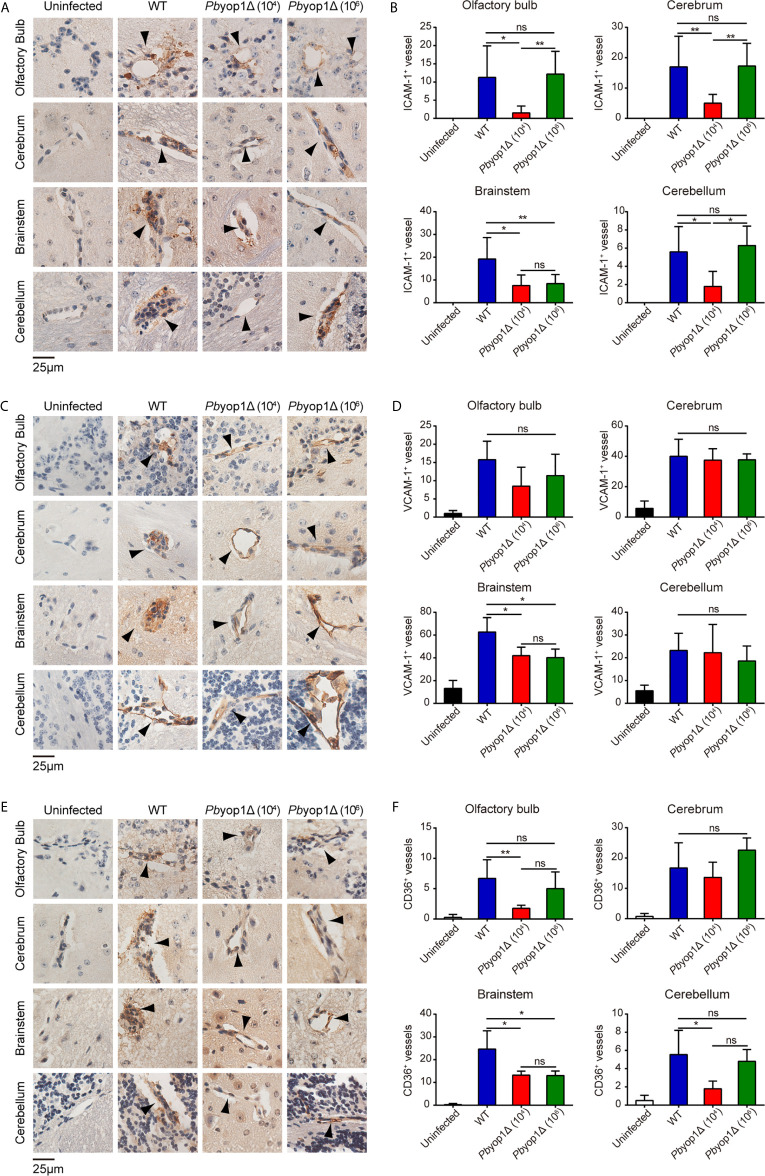
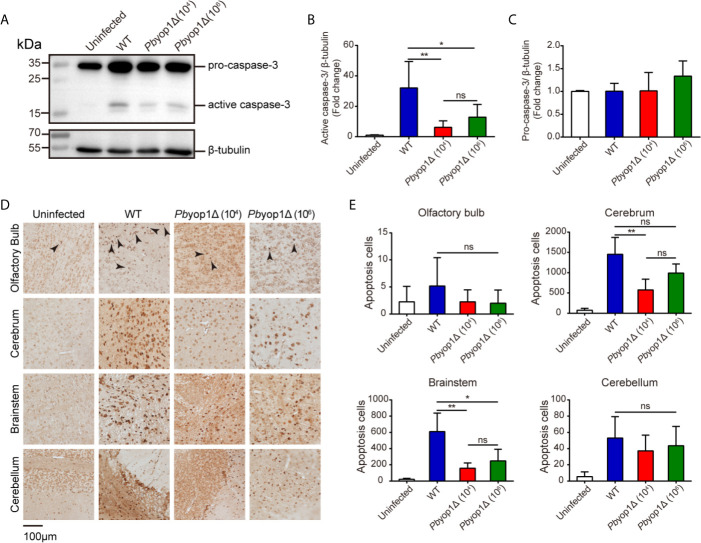
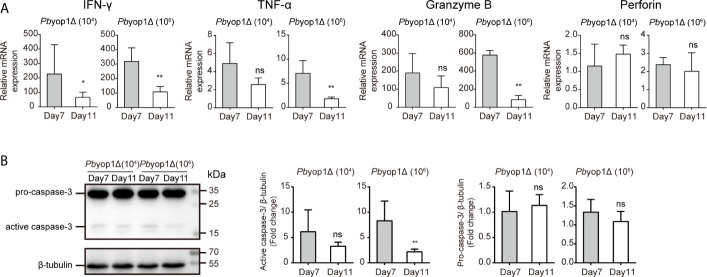
Reticulon and the REEP family of proteins stabilize the high curvature of endoplasmic reticulum tubules. The REEP5 homolog in Plasmodium, Plasmodium berghei YOP1 (PbYOP1), plays an important role in the erythrocytic cycle of the P. berghei ANKA and the pathogenesis of experimental cerebral malaria (ECM), but the mechanisms are largely unknown. Here, we show that protection from ECM in Pbyop1Δ-infected mice is associated with reduced intracerebral Th1 accumulation, decreased expression of pro-inflammatory cytokines and chemokines, and attenuated pathologies in the brainstem, though the total number of CD4+ and CD8+ T cells sequestered in the brain are not reduced. Expression of adhesive molecules on brain endothelial cells, including ICAM-1, VCAM-1, and CD36, are decreased, particularly in the brainstem, where fatal pathology is always induced during ECM. Subsequently, CD8+ T cell-mediated cell apoptosis in the brain is compromised. These findings suggest that Pbyop1Δ parasites can be a useful tool for mechanistic investigation of cerebral malaria pathogenesis.

Keywords: Plasmodium berghei; T cell; YOP1; cerebral malaria; immune response.


Conflict of interest statement

The authors declare that the research was conducted in the absence of any commercial or financial relationships that could be construed as a potential conflict of interest.

Figures

Figure 1
Figure 1
PbYOP1 deficiency attenuates the virulence of parasites in inducing ECM. (A) Survival curve of C57BL/6 mice infected with WT (1×10⁴, n = 22) or Pbyop1Δ parasites (1×10⁴, n = 21; 1×10⁶, n = 20). Data are combined from three independent experiments. ****P < 0.0001 as determined by log-rank (Mantel-Cox) test. (B) 7 days post-infection, 1×10⁶ Pbyop1Δ-infected mice (n = 10) developed peripheral blood parasitemia similar to mice infected with 1×10⁴ WT parasites (n = 10). (C) Real-time PCR analysis of P. berghei 18S rRNA expression in the brain. Mouse β-actin was used as the internal control (n = 5/group). Data are presented as mean ± SD. *P < 0.05; ns, not significant as determined by Kruskal-Wallis ANOVA followed by Dunn’s multiple comparisons test.
Figure 2
Figure 2
Pbyop1Δ parasites infection does not influence T cell response in peripheral blood. (A) Representative flow cytometry dot plots showing the CD8+ T cells and CD4+ T cells in peripheral blood mononuclear cells from uninfected, WT parasite-infected (104), and Pbyop1Δ parasite-infected (104 or 106) mice 7 dpi. The frequency and cell number of CD8+ T cells (B) and CD4+ T cells (C) was quantified. Data are presented as mean ± SD (n = 6/group) and are representative of three independent experiments. Analyses were carried out by one-way ANOVA followed by Tukey’s multiple comparison test.
Figure 3
Figure 3
Pbyop1Δ parasites infection does not influence T cell infiltration in the brain. (A) Representative flow cytometry dot plots showing the frequency of CD8+ and CD4+ T cells sequestered in the brains of uninfected, WT parasites (104)-infected, and Pbyop1Δ parasites (104 and 106)-infected mice 7 dpi. The frequency and number of CD8+ T cells (B) and CD4+ T cells (C) were quantified. Data are shown as mean ± SD (n = 5/group) and are representative of three independent experiments. **P < 0.01, ***P < 0.001; ns, not significant as determined by one-way ANOVA followed by Tukey’s multiple comparison test.
Figure 4
Figure 4
Th1 cells are decreased in the brains of Pbyop1Δ parasite-infected mice. (A) Representative flow cytometry dot plots showing Th1 cells in the peripheral blood of uninfected, WT parasites-infected (104), and Pbyop1Δ parasites-infected (104 or 106) mice 7 dpi gated on CD3+ cells. (B) The frequency of Th1 cells in CD4+ T cells and the cell number of Th1 cells in peripheral blood were quantified. (C) The frequency of CD4- T-bet+ cells in T cells and cell number of CD4- T-bet+ T cells in peripheral blood were quantified. (D) Representative flow cytometry dot plots of Th1 cells in the brains of mice. (E) The frequency of Th1 cells in CD4+ T cells and the cell number of Th1 cells in brain were quantified. (F) The frequency of CD4- T-bet+ cells in T cells and cell number of CD4- T-bet+ T cells in brain were quantified. Data are displayed as mean ± SD (n = 6/group) and are representative of three independent experiments. *P < 0.05, **P < 0.01, ***P < 0.001; ns, not significant as determined by one-way ANOVA followed by Tukey’s multiple comparison test.
Figure 5
Figure 5
IFN-γ and TNF-α expression are decreased in Pbyop1Δ-infected mice. (A) IFN-γ and TNF-α mRNA expressions relative to β-actin in brain samples of uninfected and infected mice were evaluated by real-time PCR 7 dpi. (B) Serum IFN-γ and TNF-α levels were quantified by ELISA 7 dpi. Data are presented as mean ± SD (n = 5/group) and are representative of three independent experiments. *P < 0.05, **P < 0.01, ***P < 0.001, ****P < 0.0001; ns, not significant as determined by one-way ANOVA followed by Tukey’s multiple comparison test.
Figure 6
Figure 6
ICAM-1, VCAM-1, and CD36 expression are downregulated in the brainstem of Pbyop1Δ parasites-infected mice. (A, C, E) Representative images of IHC staining of ICAM-1, VCAM-1, or CD36 in different brain regions of mice infected with 104 WT parasites (n = 11), 104 Pbyop1Δ parasites (n = 5), or 106 Pbyop1Δ parasites (n = 5) and uninfected mice (n = 4). (B, D, F) The bar graphs show quantification of the data in (A, C, E). ICAM-1, VCAM-1, or CD36-positive vessels (black arrows) were quantified for each sagittal brain section in 6 fields (olfactory bulb), 20 fields (cerebrum), 15 fields (brainstem), and 5 fields (cerebellum); one brain section per mouse. Data are presented as mean ± SD. Differences among the three groups were analyzed using Kruskal-Wallis ANOVA followed by Dunn’s multiple comparisons test: *P < 0.05, **P < 0.01; ns, not significant.
Figure 7
Figure 7
Cell apoptosis is attenuated in the brains of Pbyop1Δ parasite-infected mice. (A) Representative image of caspase-3 expression in the brains of uninfected (n = 4), WT parasites-infected (104, n = 11), and Pbyop1Δ parasites-infected (104 or 106, n = 5) mice 7 dpi. The bar graphs show the quantification of the data in (A). The gray value of active caspase-3 (B) and pro-caspase-3 (C) is normalized to β-tubulin. (D) Representative images of TUNEL staining of apoptotic cells in different brain regions 7 dpi. (E) Apoptotic cells shown in (D) were quantified for each sagittal brain section in 2 fields (olfactory bulb), 10 fields (cerebrum), 3 fields (brainstem), and 2 fields (cerebellum); one brain section per mouse. Data are presented as the mean ± SD. Differences among the three groups were analyzed using Kruskal-Wallis ANOVA followed by Dunn’s multiple comparisons test: *P < 0.05, **P < 0.01; ns, not significant.
Figure 8
Figure 8
Inflammation is further alleviated in the brains of Pbyop1Δ parasite-infected mice. (A) IFN-γ, TNF-α, granzyme B, and perforin mRNA expression relative to β-actin in brains from mice infected with 104 or 106 Pbyop1Δ parasites was evaluated by real-time PCR 7 and 11 dpi. (B) Representative image and quantification of caspase-3 expression in the brain 7 and 11 dpi. Data are presented as mean ± SD (n = 5/group) and are representative of three independent experiments. *P < 0.05, **P < 0.01; ns, not significant as determined by the Mann-Whitney U test.

Similar articles

Cited by

References

    1. World Health Organization . World Malaria Report 2020. Geneva: World Health Organization; (2020).
    1. Taylor TE, Fu WJ, Carr RA, Whitten RO, Mueller JS, Fosiko NG, et al. . Differentiating the Pathologies of Cerebral Malaria by Postmortem Parasite Counts. Nat Med (2004) 10(2):143–5. 10.1038/nm986 - DOI - PubMed
    1. Engwerda C, Belnoue E, Grüner AC, Rénia L. Experimental Models of Cerebral Malaria. Curr Top Microbiol Immunol (2005) 297:103–43. 10.1007/3-540-29967-X_4 - DOI - PubMed
    1. Strangward P, Haley MJ, Shaw TN, Schwartz JM, Greig R, Mironov A, et al. . A Quantitative Brain Map of Experimental Cerebral Malaria Pathology. PloS Pathog (2017) 13(3):e1006267. 10.1371/journal.ppat.1006267 - DOI - PMC - PubMed
    1. Promeneur D, Lunde LK, Amiry-Moghaddam M, Agre P. Protective Role of Brain Water Channel AQP4 in Murine Cerebral Malaria. Proc Natl Acad Sci USA (2013) 110(3):1035–40. 10.1073/pnas.1220566110 - DOI - PMC - PubMed

Publication types

Substances