

Tumor Immune Microenvironment Characterization Identifies Prognosis and Immunotherapy-Related Gene Signatures in Melanoma
- PMID: 34025664
- PMCID: PMC8134682
- DOI: 10.3389/fimmu.2021.663495
Tumor Immune Microenvironment Characterization Identifies Prognosis and Immunotherapy-Related Gene Signatures in Melanoma
Abstract
Background: The tumor microenvironment (TME) involves infiltration of multiple immune cell subsets, which could influence the prognosis and clinical characteristics. The increasing evidence on the role of tumor-infiltrating lymphocytes (TILs) in primary and metastatic melanomas supports that the immune system is involved in the progression and outcomes of melanoma. However, the immune infiltration landscape in melanoma has not been systematically elucidated.
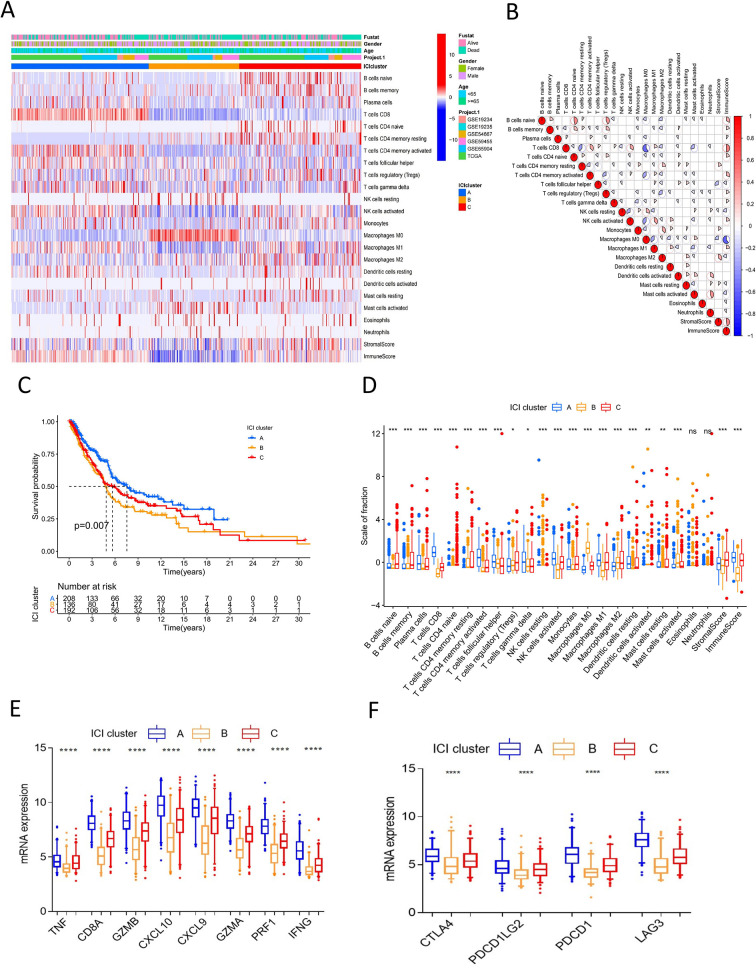
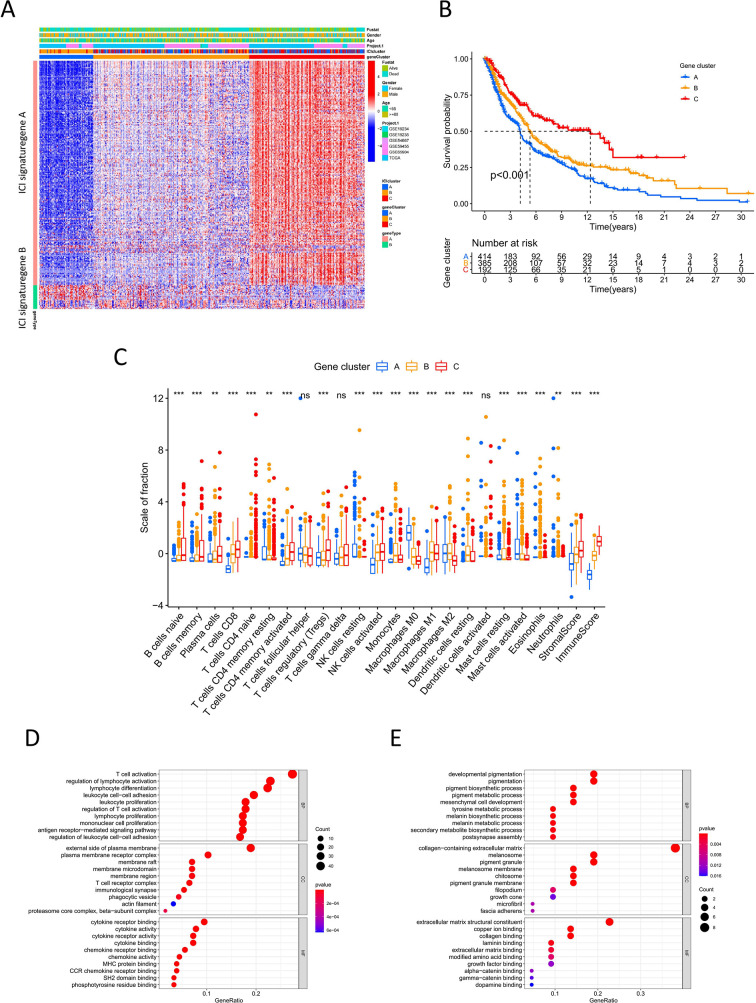
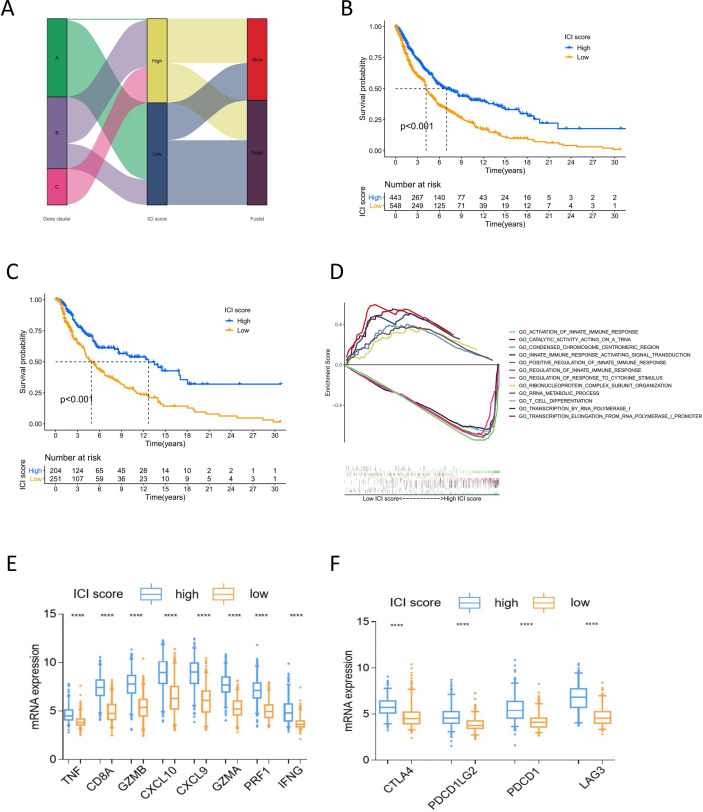
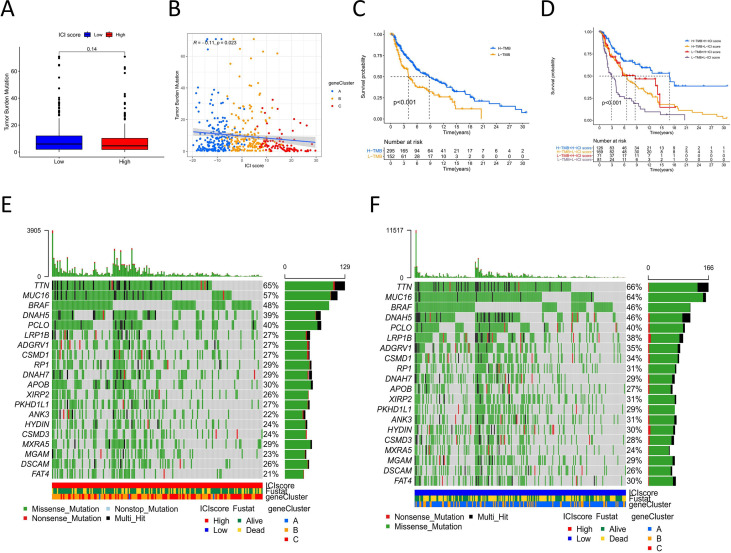
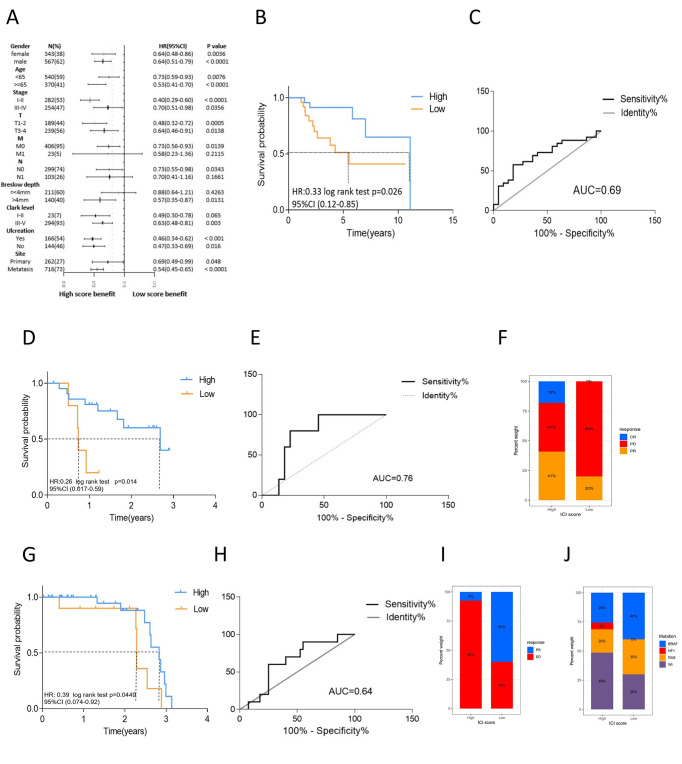
Methods: In this study, we used CIBERSORT and ESTIMATE algorithms to analyze immune infiltration pattern of 993 melanoma samples. Then we screened differential expression genes (DEGs) related to immune subtypes and survival. The immune cell infiltration (ICI) score was constructed by using principal-component analysis (PCA) based on immune signature genes from DGEs. Gene set enrichment analysis (GSEA) was applied to explore high and low ICI score related pathways. Finally, the predictive ability of ICI score was evaluated in survival prognosis and immunotherapy benefit.
Result: We identified three ICI clusters and three gene clusters associated with different immune subtypes and survival outcomes. Then the ICI score was constructed, and we found that high ICI score exhibited activated immune characteristics and better prognosis. High ICI score was significantly enriched in immune pathways and highly expressed immune signature genes. More importantly, we confirmed that melanoma patients with high ICI score had longer overall survival and rate of response to immunotherapy.
Conclusion: We presented a comprehensive immune infiltration landscape in melanoma. Our results will facilitate understanding of the melanoma tumor microenvironment and provide a new immune therapy strategy.
Keywords: immune cell infiltration; immune therapy; melanoma; prognosis; tumor microenvironment.
Copyright © 2021 Liu, Yang and Wu.
Conflict of interest statement
The authors declare that the research was conducted in the absence of any commercial or financial relationships that could be construed as a potential conflict of interest.
Figures
Similar articles
-
Development and Validation of a CD8+ T Cell Infiltration-Related Signature for Melanoma Patients.Front Immunol. 2021 May 10;12:659444. doi: 10.3389/fimmu.2021.659444. eCollection 2021. Front Immunol. 2021. PMID: 34040608 Free PMC article.
-
Pan-Cancer Analysis of Immune Cell Infiltration Identifies a Prognostic Immune-Cell Characteristic Score (ICCS) in Lung Adenocarcinoma.Front Immunol. 2020 Jun 30;11:1218. doi: 10.3389/fimmu.2020.01218. eCollection 2020. Front Immunol. 2020. PMID: 32714316 Free PMC article.
-
Cross-talk of four types of RNA modification writers defines tumor microenvironment and pharmacogenomic landscape in colorectal cancer.Mol Cancer. 2021 Feb 8;20(1):29. doi: 10.1186/s12943-021-01322-w. Mol Cancer. 2021. PMID: 33557837 Free PMC article.
-
Immune microenvironment infiltration landscape and immune-related subtypes in prostate cancer.Front Immunol. 2023 Jan 9;13:1001297. doi: 10.3389/fimmu.2022.1001297. eCollection 2022. Front Immunol. 2023. PMID: 36700224 Free PMC article. Review.
-
Tumor-infiltrating lymphocytes in melanoma: from prognostic assessment to therapeutic applications.Front Immunol. 2024 Dec 6;15:1497522. doi: 10.3389/fimmu.2024.1497522. eCollection 2024. Front Immunol. 2024. PMID: 39712007 Free PMC article. Review.
Cited by
-
5mC modification patterns provide novel direction for early acute myocardial infarction detection and personalized therapy.Front Cardiovasc Med. 2022 Dec 23;9:1053697. doi: 10.3389/fcvm.2022.1053697. eCollection 2022. Front Cardiovasc Med. 2022. PMID: 36620624 Free PMC article.
-
Tissue-resident memory T cell signatures from single-cell analysis associated with better melanoma prognosis.iScience. 2024 Feb 20;27(3):109277. doi: 10.1016/j.isci.2024.109277. eCollection 2024 Mar 15. iScience. 2024. PMID: 38455971 Free PMC article.
-
P16-CD8-Ki67 Triple Algorithm for Prediction of CDKN2A Mutations in Patients with Multiple Primary and Familial Melanoma.Diagnostics (Basel). 2024 Apr 13;14(8):813. doi: 10.3390/diagnostics14080813. Diagnostics (Basel). 2024. PMID: 38667459 Free PMC article.
-
H3K4me3-related lncRNAs signature and comprehensive analysis of H3K4me3 regulating tumor immunity in lung adenocarcinoma.Respir Res. 2023 May 3;24(1):122. doi: 10.1186/s12931-023-02418-1. Respir Res. 2023. PMID: 37131252 Free PMC article.
-
An artificial intelligence-based model exploiting H&E images to predict recurrence in negative sentinel lymph-node melanoma patients.J Transl Med. 2024 Sep 12;22(1):838. doi: 10.1186/s12967-024-05629-2. J Transl Med. 2024. PMID: 39267101 Free PMC article.
References
-
- Pietrantonio F, Randon G, Di Bartolomeo M, Luciani A, Chao J, Smyth EC, et al. . Predictive Role of Microsatellite Instability for PD-1 Blockade in Patients With Advanced Gastric Cancer: A Meta-Analysis of Randomized Clinical Trials. ESMO Open (2021) 6(1):100036. 10.1016/j.esmoop.2020.100036 - DOI - PMC - PubMed
Publication types
MeSH terms
Substances
LinkOut - more resources
Full Text Sources
Other Literature Sources
Medical