. 2021 May 5:12:669241.
doi: 10.3389/fimmu.2021.669241. eCollection 2021.

Epigenetic Regulation of BST-2 Expression Levels and the Effect on HIV-1 Pathogenesis

Affiliations

Epigenetic Regulation of BST-2 Expression Levels and the Effect on HIV-1 Pathogenesis

Ravesh Singh et al. Front Immunol. .

Abstract

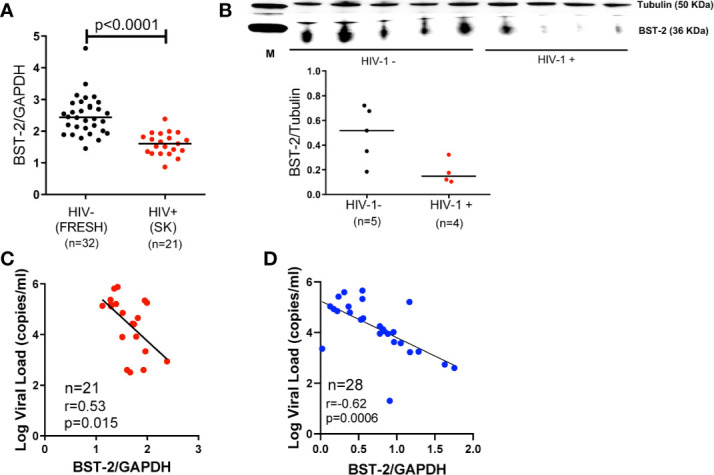
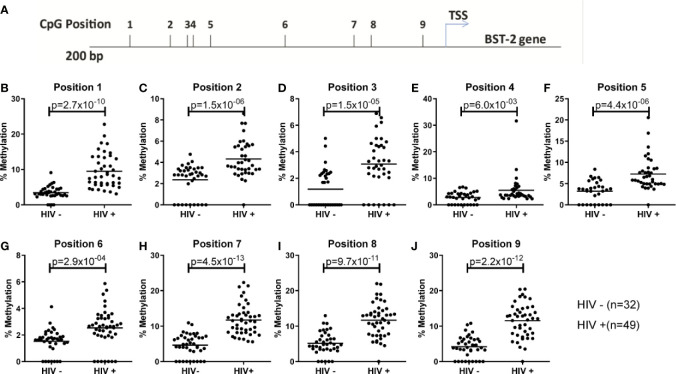
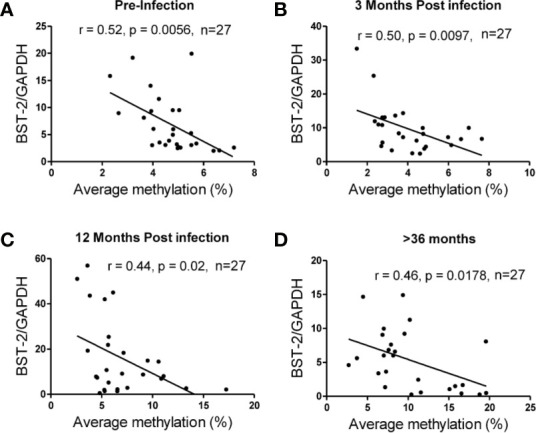
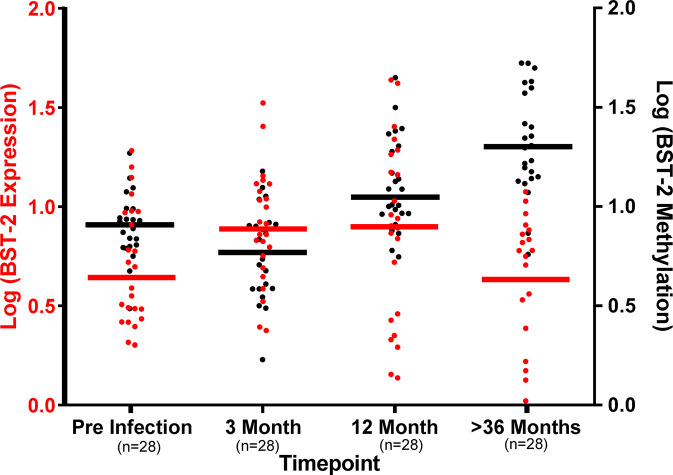
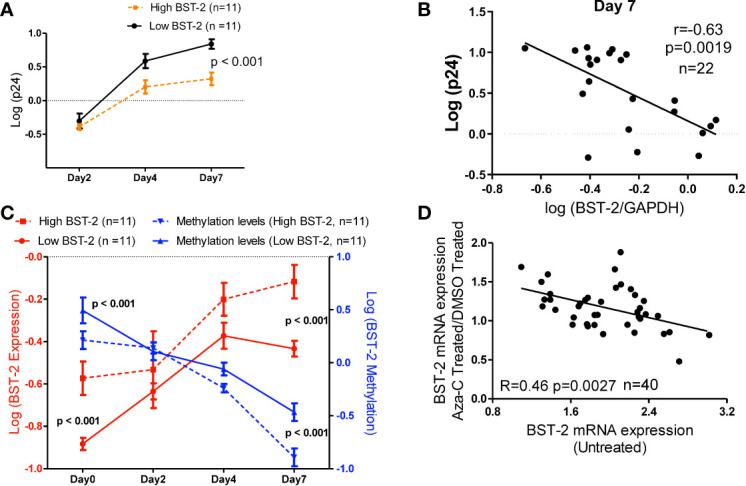
HIV-1 must overcome host antiviral restriction factors for efficient replication. We hypothesized that elevated levels of bone marrow stromal cell antigen 2 (BST-2), a potent host restriction factor that interferes with HIV-1 particle release in some human cells and is antagonized by the viral protein Vpu, may associate with viral control. Using cryopreserved samples, from HIV-1 seronegative and seropositive Black women, we measured in vitro expression levels of BST-2 mRNA using a real-time PCR assay and protein levels were validated by Western blotting. The expression level of BST-2 showed an association with viral control within two independent cohorts of Black HIV infected females (r=-0.53, p=0.015, [n =21]; and r=-0.62, p=0.0006, [n=28]). DNA methylation was identified as a mechanism regulating BST-2 levels, where increased BST-2 methylation results in lower expression levels and associates with worse HIV disease outcome. We further demonstrate the ability to regulate BST-2 levels using a DNA hypomethylation drug. Our results suggest BST-2 as a factor for potential therapeutic intervention against HIV and other diseases known to involve BST-2.

Keywords: BST-2; DNA methylation; HIV-1; epigenetic regulation; expression.


Conflict of interest statement

The authors declare that the research was conducted in the absence of any commercial or financial relationships that could be construed as a potential conflict of interest. The handling Editor declared a shared affiliation, though no other collaboration, with one of the authors [MC].

Figures

Figure 1
Figure 1
BST-2 mRNA and protein expression levels within HIV-negative and positive individuals. (A) Comparison of BST-2 mRNA expression levels measured in HIV negative and positive donors from the FRESH, (black dots), and SK, (red dots) cohorts, respectively. Significantly elevated BST-2 levels are found within HIV negative donors vs. positives (p<0.0001). These represent unmatched donors from two separate cohorts. The HIV positive donors are ARV naïve chronically infected. (B) Protein levels of BST-2 were measured on 5 HIV negative donors and 4 HIV infected donors from the FRESH and SK cohorts, respectively. BST-2 protein levels were assessed using a Western blot assay. The levels of HIV infected donors are lower than the HIV negative. (C) BST-2 mRNA expression levels were correlated with log viral load within the SK cohort. Higher mRNA levels correlated with lower log viral load levels (r=-0.53, p=0.0150). (D) A negative correlation was also observed when examining the effect of BST-2 mRNA expression levels and viral load using the CAPRISA 002 cohort at the >36 month time point (r=-0.62, p=0.0006).
Figure 2
Figure 2
Examining DNA methylation levels across unmatched HIV uninfected and infected donors. (A) Location of nine CpG sites within the BST-2 promoter region 200bp upstream of the TSS. (B-J) Using HIV negative (FRESH) and HIV positive (SK) cohorts the percentage methylation, using pyrosequencing of bisulfite converted DNA, was calculated for each of the nine sites.
Figure 3
Figure 3
Correlation of DNA methylation and BST-2 mRNA expression levels across HIV disease. Average methylation was calculated as the average methylation level across nine sites within 200bp upstream of the transcription start site. A strong negative correlation was observed at each of the time points examined for a set of n=27 matched samples at varying time points across disease progression. (A) pre-infection (r=-0.52, p=0.0056), (B) 3 months’ post infection (r=-0.50, p=0.0097), (C) 12 months’ post infection (r=-0.44, p=0.02) and (D) >36 months (r=-0.46, p=0.0178).
Figure 4
Figure 4
DNA methylation levels dictate BST-2 mRNA levels during HIV disease. Baseline levels of 27 matched samples at varying time points across disease progression show at the pre-infection higher methylation (Black) and low BST-2 expression (Red), while at acute infection (3-month post infection) methylation and expression levels are at similar level, due to IFN induction. The BST-2 expression and methylation levels invert at 12 months’ post infection. The most dramatic difference is observed at the >36 months timepoint, these individuals are at a chronic phase of infection, at this time point we observe the lowest expression and highest methylation.
Figure 5
Figure 5
BST-2 mRNA expression and methylation levels correlate in an in vitro viral replication assay, and treatment with a DNA hypo-methylation drug increases BST-2 mRNA expression levels. (A) Individuals were pre-selected based on BST-2 expression levels for a HIV replication assay. PBMCs from HIV negative donors (n=22) were infected with HIV IIIB viral strain, the amount of virus present was determined by measuring the p24 antigen using an ELISA assay. Measurements of p24 for both high and low BST-2 donors were taken at days 2, 4 and 7. Donors with higher BST-2 levels (dotted line) had lower level of p24, while donors with lower BST-2 levels (solid line) had significantly higher p24 levels (p<0.001). (B) A negative correlation was observed when comparing the HIV replication levels against the BST-2 mRNA levels at day 7 from the in vitro HIV infection assay (r=-0.63, p=0.0019). (C) mRNA and DNA were used to measure BST-2 expression (red) and methylation levels (blue), respectively, from high and low BST-2 donors (n=22) at four time points during the viral replication assay, days 0, 2, 4 and 7. Within high BST-2 donors, we find high expression (red dotted line) associated with lower methylation (blue dotted line) and vice versa for low BST-2 levels, where low expression (red solid line) associated with higher methylation (blue solid line). (D) PBMCs from HIV negative donors (n=40) were split into three subsets; the first subset was treated with a DNA methyltransferase inhibitor that causes hypomethylation (5’-Aza-CdR), while the second subset was treated with DMSO. Both subsets were incubated for 24 hours. BST-2 mRNA expression from 5’-Aza-CdR and DMSO treated cells were compared and plotted as a fold change against BST-2 mRNA from an untreated time point (third subset), a significant correlation was observed (R=-0.46, p=0.0027).

Similar articles

Cited by

References

    1. Neil S, Bieniasz P. Human Immunodeficiency Virus, Restriction Factors, and Interferon. J Interferon Cytokine Res Off J Int Soc Interferon Cytokine Res (2009) 29:569–80. 10.1089/jir.2009.0077 - DOI - PMC - PubMed
    1. Jolly C. Cell-to-Cell Transmission of Retroviruses: Innate Immunity and Interferon-Induced Restriction Factors. Virology (2011) 411:251–9. 10.1016/j.virol.2010.12.031 - DOI - PMC - PubMed
    1. McNab F, Mayer-Barber K, Sher A, Wack A, O’Garra A. Type I Interferons in Infectious Disease. Nat Rev Immunol (2015) 15:87–103. 10.1038/nri3787 - DOI - PMC - PubMed
    1. Sivro A, Su RC, Plummer FA, Ball TB. Interferon Responses in HIV Infection: From Protection to Disease. AIDS Rev (2014) 16:43–51. - PubMed
    1. Neil SJ, Zang T, Bieniasz PD. Tetherin Inhibits Retrovirus Release and is Antagonized by HIV-1 Vpu. Nature (2008) 451:425–30. 10.1038/nature06553 - DOI - PubMed

Publication types

MeSH terms