

The effects of pH and NaCl concentration on the structure of β-casein from buffalo milk
- PMID: 34026061
- PMCID: PMC8121154
- DOI: 10.1002/fsn3.2157
The effects of pH and NaCl concentration on the structure of β-casein from buffalo milk
Abstract
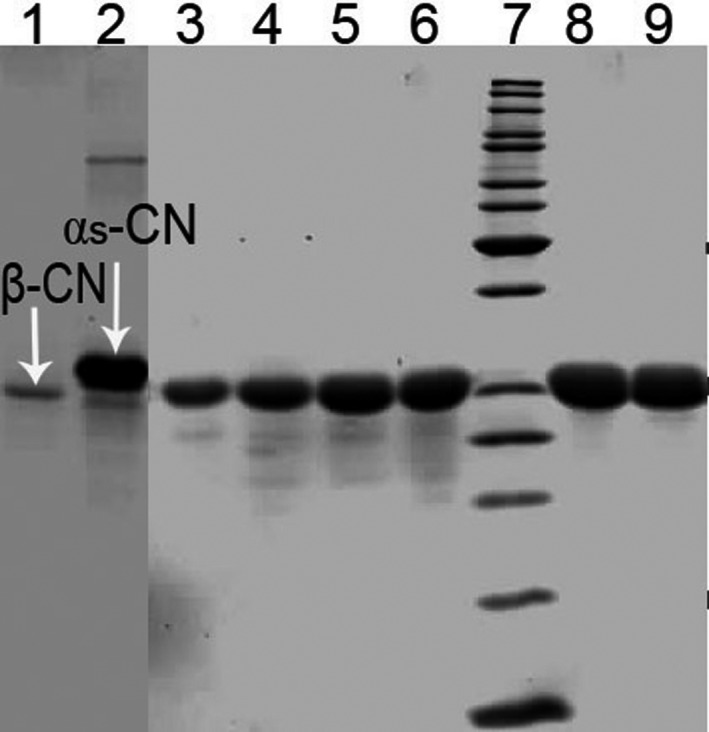
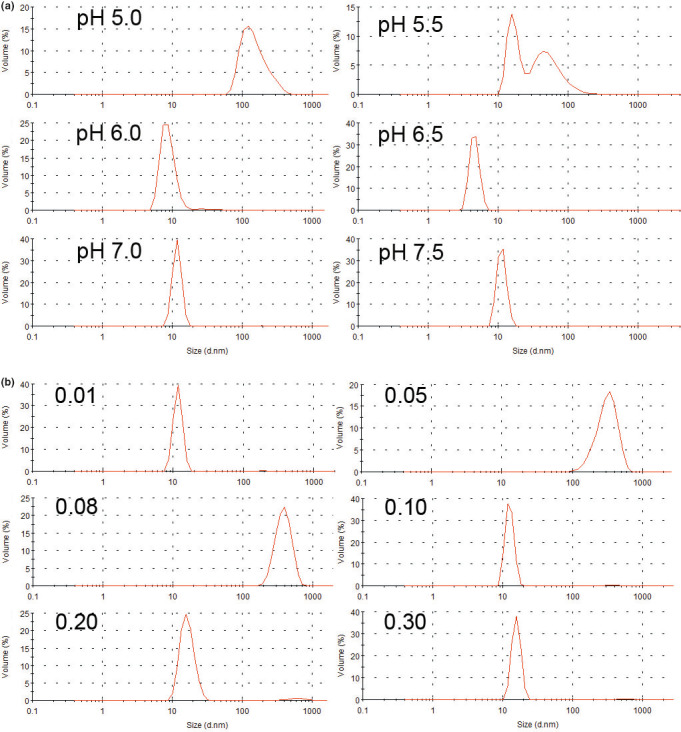
In the present study, we aimed to investigate the effects of pH and sodium chloride (NaCl) concentration on the structure of β-casein (β-CN) purified from buffalo milk using circular dichroism (CD), intrinsic tryptophan, and anilino-8-naphthalene sulfonate (ANS) fluorescence spectroscopy. We found that NaCl concentration played a critical role in the stability of the secondary structure of β-CN. The CD negative peak had a redshift as the NaCl concentration was increased and accompanied by a decrease of β-sheet content and an increase of α-helix content. ANS fluorescence spectroscopy also indicated that higher NaCl concentration and lower pH significantly affected the tertiary structure of β-CN. Dynamic light scattering (DLS) results showed that the particle size of buffalo β-CN had a blueshift, and then a redshift within the pH range of 5.0-7.5, and it showed a redshift when the NaCl concentration was increased.
Keywords: buffalo milk; circular dichroism; fluorescence spectrometry; β‐casein.
© 2021 The Authors. Food Science & Nutrition published by Wiley Periodicals LLC.
Conflict of interest statement
All authors declare that there is no conflict of interest.
Figures


Similar articles
-
[Effect of pH on circular dichroism and Raman spectroscopy of secondary structure of beta-casein from Chinese human milk].Guang Pu Xue Yu Guang Pu Fen Xi. 2015 Feb;35(2):384-9. Guang Pu Xue Yu Guang Pu Fen Xi. 2015. PMID: 25970897 Chinese.
-
Micellisation and immunoreactivities of dimeric beta-caseins.Biochim Biophys Acta. 2009 Dec;1794(12):1775-83. doi: 10.1016/j.bbapap.2009.08.015. Epub 2009 Aug 20. Biochim Biophys Acta. 2009. PMID: 19699329
-
1-Anilino-8-naphthalene sulfonate (ANS) is not a desirable probe for determining the molten globule state of chymopapain.PLoS One. 2012;7(11):e50633. doi: 10.1371/journal.pone.0050633. Epub 2012 Nov 29. PLoS One. 2012. PMID: 23209794 Free PMC article.
-
The effects of pH, temperature, and buffer concentration on the self-assembling behavior, secondary structure, and surface hydrophobicity of donkey and bovine β-casein.Food Chem. 2024 Feb 1;433:137285. doi: 10.1016/j.foodchem.2023.137285. Epub 2023 Aug 30. Food Chem. 2024. PMID: 37683474
-
Implication of C-terminal deletion on the structure and stability of bovine beta-casein.Protein J. 2005 Nov;24(7-8):431-44. doi: 10.1007/s10930-005-7639-6. Protein J. 2005. PMID: 16328736
References
-
- Akintayo, E. T. , Oshodi, A. A. , & Esuoso, K. O. (1999). Effects of NaCl, ionic strength and pH on the foaming and gelation of pigeon pea (Cajanus cajan) protein concentrates. Food Chemistry, 66, 51–56. 10.1016/S0308-8146(98)00155-1 - DOI
-
- Boulet, M. , Britten, M. , & Lamarche, F. (2001). Dispersion of food proteins in water‐alcohol mixed dispersants. Food Chemistry, 74, 69–74. 10.1016/S0308-8146(01)00099-1 - DOI
-
- Buitenhuis, B. , Poulsen, N. A. , Gebreyesus, G. , & Larsen, L. B. (2016). Estimation of genetic parameters and detection of chromosomal regions affecting the major milk proteins and their post translational modifications in Danish Holstein and Danish Jersey cattle. BMC Genetics, 17, 114. 10.1186/s12863-016-0421-2 - DOI - PMC - PubMed
LinkOut - more resources
Full Text Sources
Other Literature Sources
