. 2021 May 16;10(5):e1285.
doi: 10.1002/cti2.1285. eCollection 2021.

Dynamics of antibodies to SARS-CoV-2 in convalescent plasma donors

Affiliations

Dynamics of antibodies to SARS-CoV-2 in convalescent plasma donors

Maurice Steenhuis et al. Clin Transl Immunology. .

Abstract

Objectives: Characterisation of the human antibody response to SARS-CoV-2 infection is vital for serosurveillance purposes and for treatment options such as transfusion with convalescent plasma or immunoglobulin products derived from convalescent plasma. In this study, we longitudinally and quantitatively analysed antibody responses in RT-PCR-positive SARS-CoV-2 convalescent adults during the first 250 days after onset of symptoms.

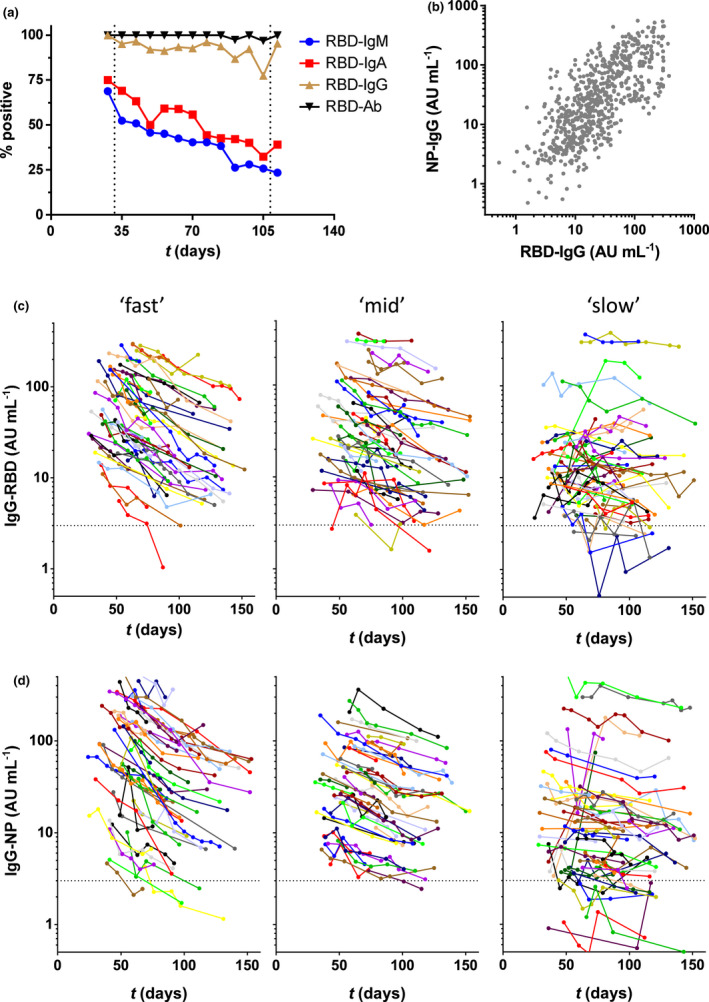
Methods: We measured antibody responses to the receptor-binding domain (RBD) of the SARS-CoV-2 spike protein and the nucleocapsid protein in 844 longitudinal samples from 151 RT-PCR-positive SARS-CoV-2 convalescent adults. With a median of 5 (range 2-18) samples per individual, this allowed quantitative analysis of individual longitudinal antibody profiles. Kinetic profiles were analysed by mixed-effects modelling.

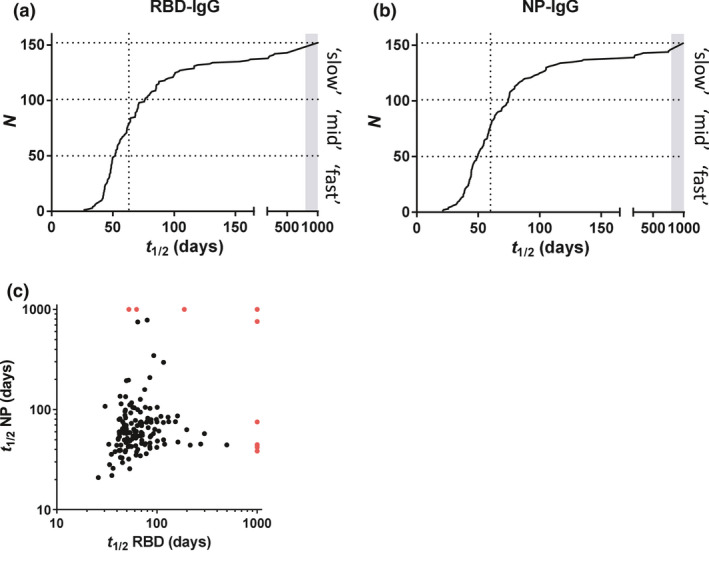
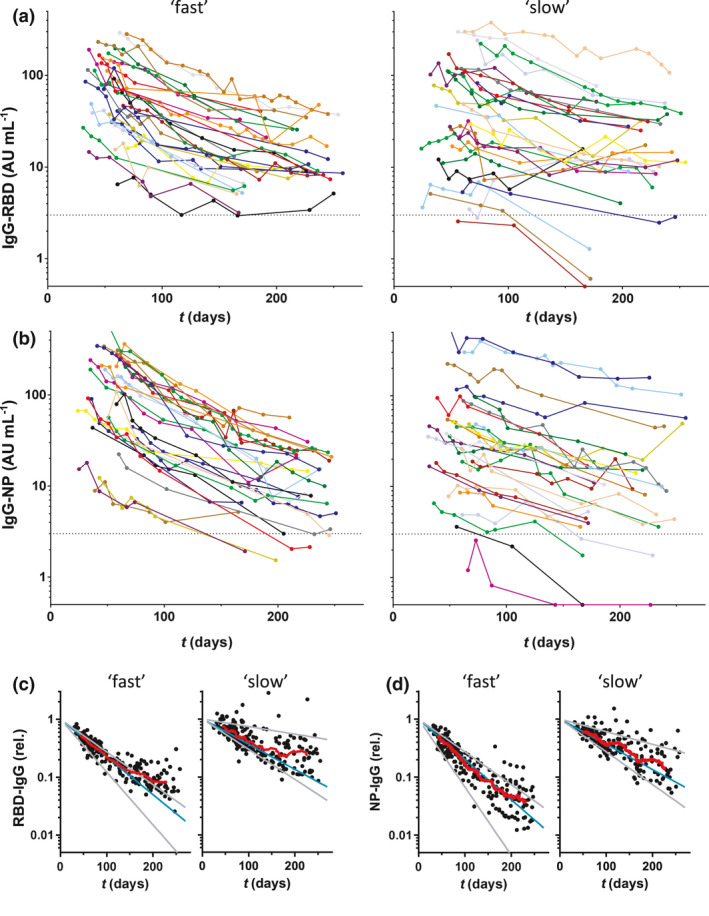
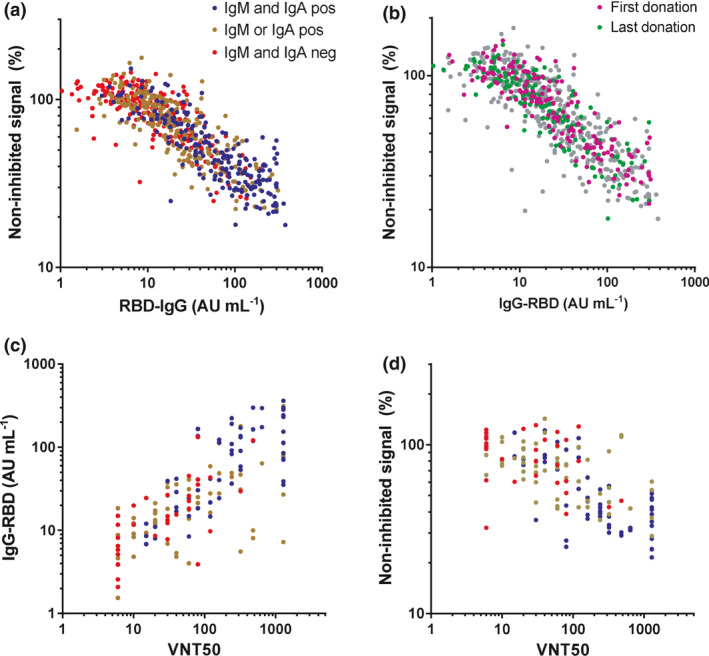
Results: All donors were seropositive at the first sampling moment, and only one donor seroreverted during follow-up analysis. Anti-RBD IgG and anti-nucleocapsid IgG levels declined with median half-lives of 62 and 59 days, respectively, 2-5 months after symptom onset, and several-fold variation in half-lives of individuals was observed. The rate of decline of antibody levels diminished during extended follow-up, which points towards long-term immunological memory. The magnitude of the anti-RBD IgG response correlated well with neutralisation capacity measured in a classic plaque reduction assay and in an in-house developed competitive assay.

Conclusion: The result of this study gives valuable insight into the long-term longitudinal response of antibodies to SARS-CoV-2.

Keywords: ACE2‐competitive ELISA; COVID‐19; antibodies; longitudinal; neutralisation.


Conflict of interest statement

The authors declare no conflict of interest.

Figures

Figure 1
Figure 1
Antibodies against SARS‐CoV‐2 in CCP donors during up to 157 days of follow‐up (period 1). (a) Seropositivity was assessed by isotype‐specific (IgM, IgA and IgG) assays and the total antibody assay RBD‐Ab. Results were stratified per week postonset symptoms; samples covering < 5 and > 15 weeks (< 32 and > 109 days) were combined. (b) Correlation between anti‐RBD and anti‐NP IgG levels. Samples from the CCP donors were tested in the RBD and NP IgG isotype‐specific assay, and their correlation was evaluated by Spearman's rank test (r = 0.73, P < 0.001). (c) Concentrations of IgG anti‐RBD and (d) anti‐NP plotted in days after onset of disease symptoms (676 samples from 151 donors). Left, middle and right panels contain samples that were stratified according to fitted half‐lives of antibody levels (see Figure 2a and b for explanation of ‘slow’, ‘mid’ and ‘fast’). All data represent the mean of at least 2 independent replicates.
Figure 2
Figure 2
Regression analysis of IgG levels. For both (a) RBD IgG and (b) NP IgG, data of period 1 were modelled using a mixed‐effects model (log‐linear in IgG; random intercept and slope, time as fixed variable). Slopes of IgG decay in time (see Figure 1) were converted into half‐lives. Dotted vertical lines indicate median half‐lives. Boundaries between ‘slow’, ‘mid’ and ‘fast’ (used to stratify data in Figure 1) are 50 and 76 days, and 48 and 73 days for RBD and NP, respectively. (c) The correlation between estimated half‐lives for anti‐RBD IgG and anti‐NP IgG levels was evaluated by Spearman's rank test (r = 0.23, P = 0.0037). In case of rising levels, t was arbitrarily assigned a value of 1000 in the above images (indicated by the grey bar (a, b) and red dots (c), respectively).
Figure 3
Figure 3
Dynamic changes in IgG antibodies against SARS‐CoV‐2 during extended follow‐up up to 250 days (period 2). Concentrations of (a) IgG anti‐RBD and (b) anti‐NP plotted in days after onset of disease symptoms (430 samples from 55 donors; mean of 2 independent replicates). Left panels, 28 donors with the fastest decline during period 1, and right panels, the slowest 27 donors, and the boundary between ‘fast’ and ‘slow’ was 56 and 55 days for RBD and NP, respectively. (c, d) Same data but normalised per donor using fitted intercepts from regression analysis of period 1. Blue and grey lines indicate median, smallest and largest fitted slopes from the same analysis (excluding positive slopes, 2 for RBD and 1 for NP) within both groups. Red lines are running averages showing an overall trend within both groups of donors.
Figure 4
Figure 4
Correlation between IgG levels and virus neutralisation. Plasma samples were tested in the in‐house developed competitive ELISA (676 samples from 151 individual donors) and in the classic plaque reduction assay (147 samples from 129 individual donors; mean of 2 independent replicates). The correlation between anti‐RBD IgG and virus neutralisation in the (a, b) competitive assay and (c) plaque reduction assay was assessed by Spearman's rank test (r = 0.85, r = 0.75, respectively, P < 0.001). (d) A correlation between the two viral neutralisation assays was also observed (Spearman's r = 0.65, P < 0.001).

References

    1. Lu R, Zhao X, Li J et al. Genomic characterisation and epidemiology of 2019 novel coronavirus: implications for virus origins and receptor binding. Lancet 2020; 395: 565–574. - PMC - PubMed
    1. Ren L‐L, Wang Y‐M, Wu Z‐Q et al. Identification of a novel coronavirus causing severe pneumonia in human: a descriptive study. Chin Med J (Engl) 2020; 133: 1015–1024. - PMC - PubMed
    1. https://covidstatistics.org/
    1. Casadevall A, Joyner MJ, Pirofski L‐A. A randomized trial of convalescent plasma for COVID‐19—potentially hopeful signals. JAMA 2020; 324: 455–457. - PubMed
    1. Chai KL, Valk SJ, Piechotta V et al. Convalescent plasma or hyperimmune immunoglobulin for people with COVID‐19: a living systematic review. Cochrane Database Syst Rev 2020; 10: CD013600. - PubMed

LinkOut - more resources