. 2021 Mar 18;8(10):2001978.
doi: 10.1002/advs.202001978. eCollection 2021 May.

A Fifteen-Gene Classifier to Predict Neoadjuvant Chemotherapy Responses in Patients with Stage IB to IIB Squamous Cervical Cancer

Affiliations

A Fifteen-Gene Classifier to Predict Neoadjuvant Chemotherapy Responses in Patients with Stage IB to IIB Squamous Cervical Cancer

Xun Tian et al. Adv Sci (Weinh). .

Abstract

Neoadjuvant chemotherapy (NACT) remains an attractive alternative for controlling locally advanced cervical cancer. However, approximately 15-34% of women do not respond to induction therapy. To develop a risk stratification tool, 56 patients with stage IB-IIB cervical cancer are included in 2 research centers from the discovery cohort. Patient-specific somatic mutations led to NACT non-responsiveness are identified by whole-exome sequencing. Next, CRISPR/Cas9-based library screenings are performed based on these genes to confirm their biological contribution to drug resistance. A 15-gene classifier is developed by generalized linear regression analysis combined with the logistic regression model. In an independent validation cohort of 102 patients, the classifier showed good predictive ability with an area under the curve of 0.80 (95% confidence interval (CI), 0.69-0.91). Furthermore, the 15-gene classifier is significantly associated with patient responsiveness to NACT in both univariate (odds ratio, 10.8; 95% CI, 3.55-32.86; p = 2.8 × 10⁻⁵) and multivariate analysis (odds ratio, 17.34; 95% CI, 4.04-74.40; p = 1.23 × 10⁻⁴) in the validation set. In conclusion, the 15-gene classifier can accurately predict the clinical response to NACT before treatment, representing a promising approach for guiding the selection of appropriate treatment strategies for locally advanced cervical cancer.

Keywords: CRISPR/Cas9‐based library screening; neoadjuvant chemotherapy; precision medicine; whole exon sequencing.


Conflict of interest statement

The authors declare no conflict of interest.

Figures

Figure 1
Figure 1
Flow diagram demonstrating the breakdown of study population. A) Discovery cohort; B) Validation cohort.
Figure 2
Figure 2
CNV and somatic mutation analysis in the training cohort. A) Heatmaps of unsupervised hierarchical clustering of copy number variation. Bar colors indicate clinical response to NACT: red indicates a non‐responder, and green indicates a responder. Colored rectangles on heatmaps show CNVs and single nucleotide variations (SNVs)/Indels. B) PCA of CNVs. C) Heatmaps of unsupervised hierarchical clustering of somatic mutations. D) PCA of somatic mutations.
Figure 3
Figure 3
Genetic mutations associated with drug resistance. A) Volcano plot representation of odds ratio analysis showing the risk of drug resistance (log 2 odds ratio) and significance (p‐value, Fisher's exact test) of associations between somatic mutations and NACT response. Each circle represents a gene, the size is proportional to the sample number mutated in the cohort, and the color indicates the p‐value. B) Schematic outline of the screening pipeline. C) Scatter plots showing enrichment of specific genes in the SiHa cell line after drug treatment. Duplicate experiments were arranged for each toxin screening, each with three replicates. The enrichment level was calculated as log 2 (Exp:Ctrl) of the normalized read counts. The enrichment genes in duplicate experiments were marked in red, and un enrichment genes were marked as dark. D) Filtration of three drug‐resistant experiments of CRISPR/Cas9 screens. Dot plots show the selection of consistently changed genes in two independent technical experiments. Venn diagram shows the final selected gene set.
Figure 4
Figure 4
Risk score calculated by three classifier and Receiver Characteristic Operator (ROC) curves. A–C) Upper‐left panel: risk score distribution of the C‐classifier, W‐classifier, and D‐classifier and the response status of 56 patients in the training cohort. Lower‐left panel: the mutational status of the C‐classifier, W‐classifier, and D‐classifier in the 56 patients. D) ROC curves of the C‐classifier, W‐classifier, D‐classifier, and clinical classifier in the training cohort.
Figure 5
Figure 5
ST6GAL2 loss leads to cisplatin/paclitaxel resistance. A) gDNA and amino acid sequences of ST6GAL2mut, respectively. B) ST6GAL2 mRNA level in the samples with missense and wild type. C,D) ST6GAL2 expression in mutation and wild genotype pretreatment tumor biopsies. E,F) Viability of SiHa cells with siRNA directed at ST6GAL2 after treatment with cisplatin/paclitaxel in vitro. G) Kaplan–Meier analysis of OS in a cervical squamous cell carcinoma dataset (n = 304).
Figure 6
Figure 6
VPS13C gene loss leads to cisplatin/paclitaxel resistance. A) gDNA and amino acid sequences of VPS13Cmut, respectively. B,C) Viability of SiHa cells with siRNA directed at VPS13C after treatment with cisplatin/paclitaxel in vitro. D) Kaplan–Meier analysis of OS in a cervical squamous cell carcinoma dataset (n = 304).
Figure 7
Figure 7
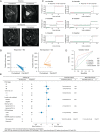
Performance of three genomic classifiers and ability to discriminate between responder and non‐responder patients in an independent validation cohort. A) Sagittal T2‐weighted MRI of the pelvis showing the cervical tumor. B) Relative change in cervical cancer, measured by 3D ultrasound in the validation cohort. C) Probability plot based on the C‐classifier, W‐classifier, and D‐classifier for correct class prediction. Training and Validation set: red circles indicate non‐responder; green circles indicate responder. D) ROC curves of the C‐classifier, W‐classifier, D‐classifier, and clinical classifier in the validation cohort. E) Association of Clinical Variables, C‐classifier With Response to NACT.

References

    1. Bray F., Ferlay J., Soerjomataram I., Siegel R. L., Torre L. A., Jemal A., Ca‐Cancer J. Clin. 2018, 68, 394. - PubMed
    1. Abu‐Rustum N. R., Yashar C. M., Bean S., Bradley K., Campos S. M., Chon H. S., Chu C., Cohn D., Crispens M. A., Damast S., Fisher C. M., Frederick P., Gaffney D. K., Giuntoli R., Han E., Huh W. K., Lurain J. R. III, Mariani A., Mutch D., Nagel C., Nekhlyudov L., Fader A. N., Remmenga S. W., Reynolds R. K., Sisodia R., Tillmanns T., Ueda S., Urban R., Wyse E., McMillian N. R., Motter A. D., J. Natl. Compr. Canc. Netw. 2020, 18, 660. - PubMed
    1. C. Chemoradiotherapy for Cervical Cancer Meta‐Analysis , J. Clin. Oncol. 2008, 26, 5802. - PMC - PubMed
    1. Wo J. Y., Viswanathan A. N., Int. J. Radiat. Oncol., Biol., Phys. 2009, 73, 1304.
    1. Gaffney D. K., Du Bois A., Narayan K., Reed N., Toita T., Pignata S., Blake P., Portelance L., Sadoyze A., Potter R., Colombo A., Randall M., Mirza M. R., Trimble E. L., Int. J. Radiat. Oncol., Biol., Phys. 2007, 68, 485. - PubMed

Publication types

MeSH terms