. 2021 Mar 16;8(10):2002787.
doi: 10.1002/advs.202002787. eCollection 2021 May.

Tumor Exosomes Reprogrammed by Low pH Are Efficient Targeting Vehicles for Smart Drug Delivery and Personalized Therapy against their Homologous Tumor

Affiliations

Tumor Exosomes Reprogrammed by Low pH Are Efficient Targeting Vehicles for Smart Drug Delivery and Personalized Therapy against their Homologous Tumor

Changguo Gong et al. Adv Sci (Weinh). .

Abstract

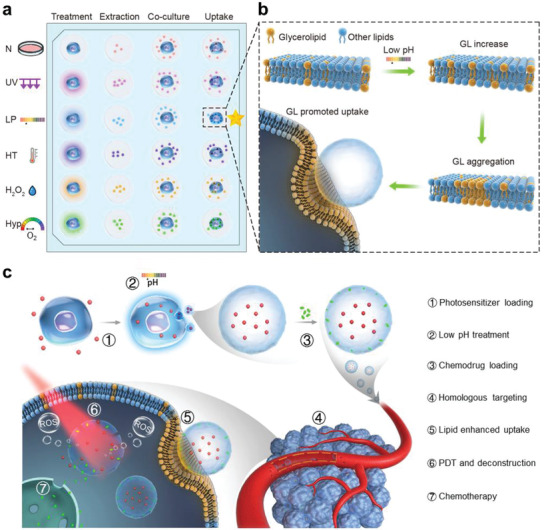
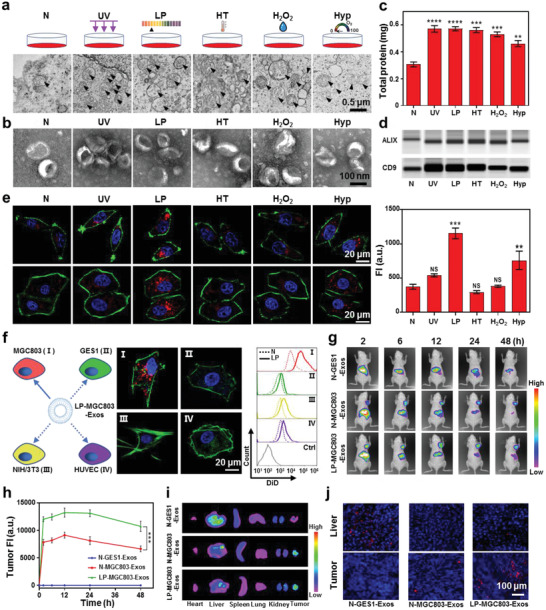
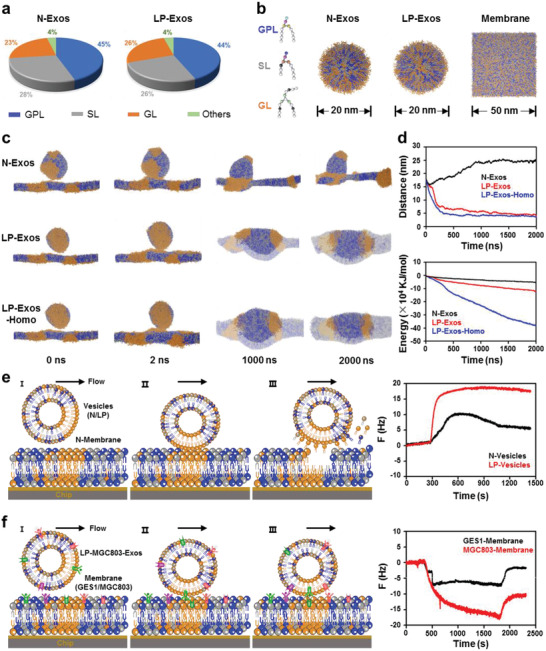
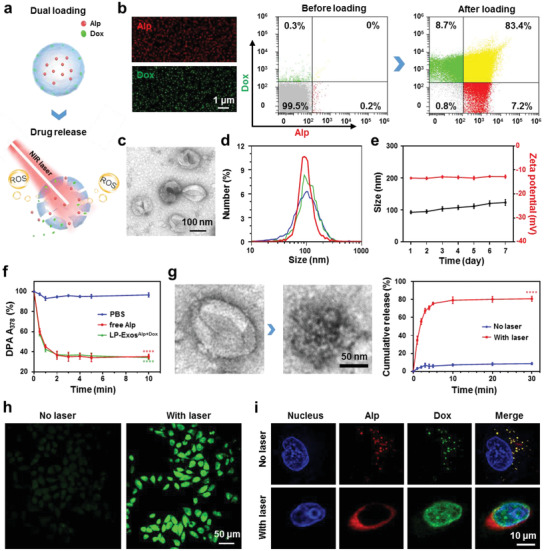
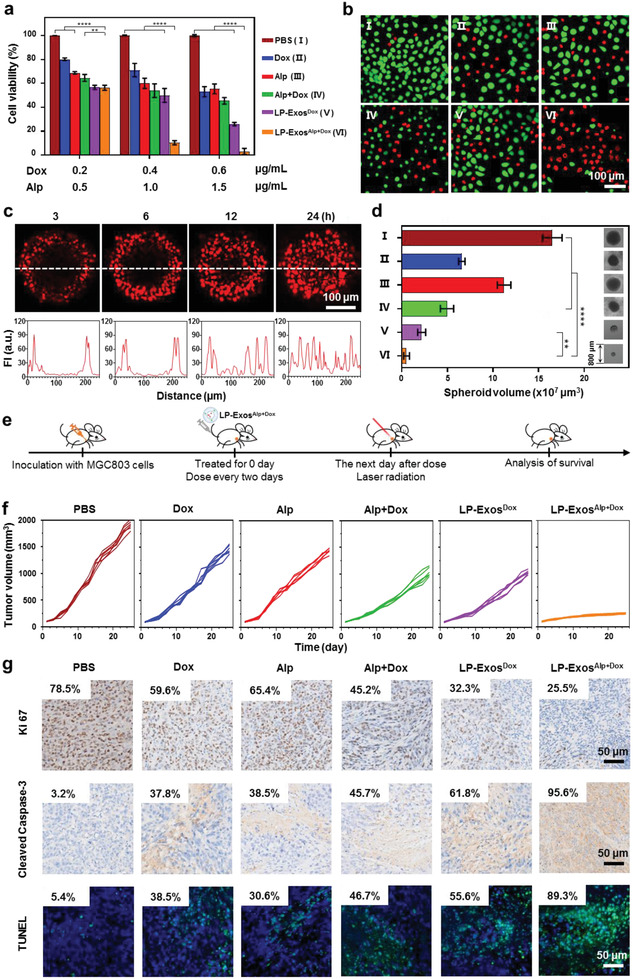
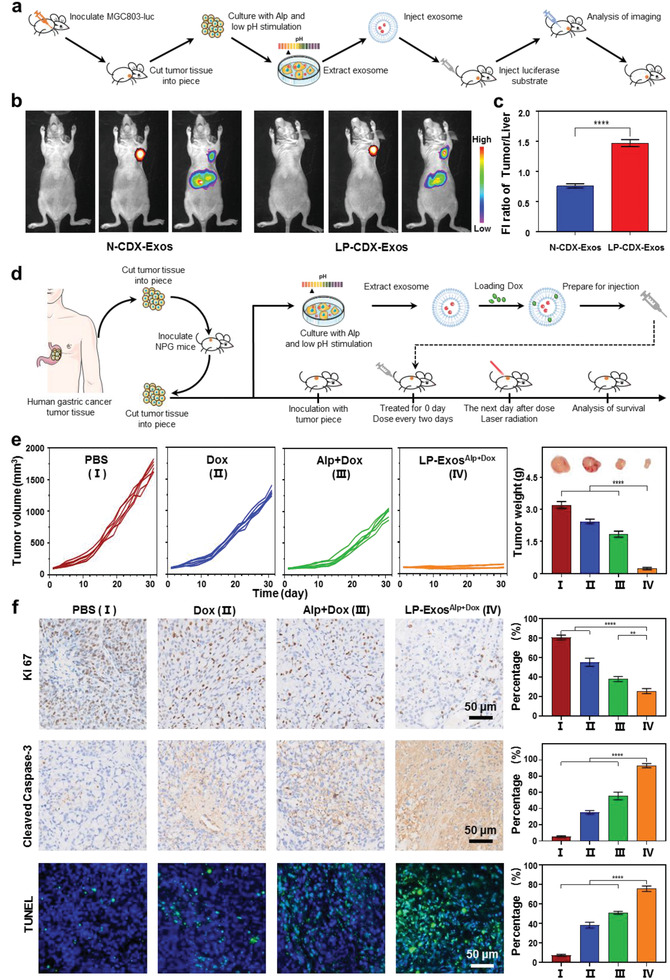
As membrane-bound extracellular vesicles, exosomes have targeting ability for specific cell types, and the cellular environment strongly impacts their content and uptake efficiency. Inspired by these natural properties, the impacts of various cellular stress conditions on the uptake efficiency of tumor iterated exosomes are evaluated, and low-pH treatment caused increased uptake efficiency and retained cell-type specificity is found. Lipidomics analyses and molecular dynamics simulations reveal a glycerolipid self-aggregation-based mechanism for the enhanced homologous uptake. Furthermore, these low-pH reprogrammed exosomes are developed into a smart drug delivery platform, which is capable of specifically targeting tumor cells and selectively releasing diverse chemodrugs in response to the exosome rupture by the near-infrared irradiance-triggered burst of reactive oxygen species. This platform exerts safe and enhanced antitumor effects demonstrated by multiple model mice experiments. These results open a new avenue to reprogram exosomes for smart drug delivery and potentially personalized therapy against their homologous tumor.

Keywords: combination therapy; lipids rearrangement; low pH reprogramming; patient‐derived xenografts; tumor exosomes.


Conflict of interest statement

The authors declare no conflict of interest.

Figures

Figure 1
Figure 1
Culture conditions and mechanisms for enhancing exosome's cell uptake and its antitumor therapy applications. a) Procedure for screening cell culture conditions to obtain exosomes with high delivery efficiency, including normal condition (N), ultraviolet irradiation stress treatment (UV), low‐pH culture medium treatment (LP), high temperature treatment (HT), H2O2 treatment (H2O2), and hypoxia environment treatment (Hyp). b) Mechanism for the enhanced uptake of the lipid‐reprogrammed exosomes. c) Strategy for drug loading and synthetically anticancer therapy combining chemotherapy with photodynamic therapy.
Figure 2
Figure 2
Screening diverse culture treatments in search of increased uptake efficiency for released exosomes and evaluation of their targeting specificity. a) TEM images of the differentially treated MGC803 cells. Black arrows: multivesicular bodies. b) TEM images of exosomes released by the differentially treated MGC803 cells. c) BCA protein concentration detection of the differentially treated exosome types. d) Immunoblotting with an antibody against ALIX (upper panel), and against CD9 (lower panel) of the differentially treated exosome types. e) CLSM images of differentially treated MGC803 exosome types uptake by MGC803 cells (upper panel) and HepG2 exosome types uptake by HepG2 cells (lower panel), and fluorescence intensity (FI) (from DiD labeled exosomes) in MGC803 cells. f) CLSM images of MGC803 exosomes treated by low pH (LP‐MGC803‐Exos) uptake by different types of cells (MGC803, GES1, NIH/3T3, and HUVEC) (left panel), and the intracellular fluorescence intensity (from DiD labeled exosomes) determined using flow cytometry, compared with the N‐MGC803‐Exos (right panel). g) In vivo distributions of N‐GES1‐Exos, N‐MGC803‐Exos, and LP‐MGC803‐Exos in MGC803 tumor bearing BALB/c nude mice at different time points post intravenous injection. h) Quantitative time‐dependent distributions of N‐GES1‐Exos, N‐MGC803‐Exos, and LP‐MGC803‐Exos at MGC803 tumor sites. i) Ex vivo fluorescence images of main organs. j) Frozen sections of livers and tumors; nuclei and exosomes are indicted with blue and red fluorescence, respectively. Data in (c), (e), and (h) represent mean values ± SD, n = 3. Statistical differences were determined by one‐way ANOVA test. NS means no significant difference. **p < 0.01, ***p < 0.001, ****p < 0.0001.
Figure 3
Figure 3
Molecular mechanism for enhanced uptake of LP‐Exos. a) Lipidomics data for N‐Exos and LP‐Exos. b) The corresponding initial models for these two types of exosomes and cell membrane in molecular dynamics simulations. c) Typical structure diagrams for 2 µs interaction simulations of N‐Exos, LP‐Exos, and the homologous targeting LP‐Exos‐Homo with cell membrane, respectively. d) Characteristic centroid distance and energy between exosome and membrane for N‐Exos, LP‐Exos, and LP‐Exos‐Homo during the simulation process. e) Schematic illustration for QCM experiments using artificial vesicles (N‐Vesicles or LP‐Vesicles) constituted by three lipids in accordance with the simulations to flow across a lipid membrane (spin‐coated with N‐Vesicles) on the chip (left panel) to verify the advantage of LP treatment, and corresponding QCM curves (right panel). I: Start pumping vesicles; II: Vesicles contact and interact with the lipid membrane; III: Vesicles detach from the lipid membrane, accompanied by extracting membrane lipids which were slightly adhered to the chip. f) Schematic illustration for QCM experiments using LP‐MGC803‐Exos to flow across a cell membrane (spin‐coated with GES1 or MGC803 cell membrane) on the chip (left panel) to verify the homologous targeting, and corresponding QCM curves (right panel). I: Start pumping exosomes; II: Exosomes contact and interact with the cell membrane; III: Exosomes are stably adsorbed on the cell membrane which was tightly adhered to the chip.
Figure 4
Figure 4
Characterizations of drug‐loaded LP‐Exos and evaluation of laser‐controlled drug release. a) Schematic illustration of dual‐loaded LP‐Exos (upper panel) and laser‐triggered drug release from LP‐Exos (lower panel). Red: Alp; Green: Dox. b) CLSM and flow cytometry analyses of the dual‐loaded LP‐Exos. c) TEM images of the dual‐loaded LP‐Exos. d) Size distributions of the dual‐loaded LP‐Exos with three replicates. e) A typical variation in the average sizes (black line) and zeta potentials (red line) of the dual‐loaded LP‐Exos in PBS over 7 days. f) Evolution of decay curves for the relative absorption of DPA at 378 nm for the different treatments. Blue: PBS; Red: PBS+free Alp; Green: PBS+LP‐ExosAlp+Dox. g) TEM images of normal and ruptured exosomes (left panel), and spectrophotometry measuring absorption at 480 nm wavelength showing cumulative release percentage of Dox from LP‐ExosAlp+Dox with or without laser irradiation (right panel). h) Generation of ROS in the cytoplasm of MGC803 cells co‐cultured with LP‐ExosAlp+Dox using DCFH‐DA probe before and after laser irradiation. i) CLSM images for the localizations of Dox (green) and Alp (red) after LP‐ExosAlp+Dox uptake by MGC803 cells, with or without laser irradiation. Data in (e), (f), (g) represent mean values ± SD, n = 3. Statistical differences in (f) were determined by one‐way ANOVA test. Statistical differences in (g) were determined by two‐tailed student's t‐test. **** p < 0.0001.
Figure 5
Figure 5
Anticancer therapy effects of the dual‐loaded LP‐Exos strategy. a) CCK‐8 cytotoxicity analysis of MGC803 cells given six treatment types, including PBS, Dox, Alp irradiated by laser (Alp), Alp and Dox irradiated by laser (Alp+Dox), Dox in LP‐Exos (LP‐ExosDox), and Alp and Dox in LP‐Exos irradiated by laser (LP‐ExosAlp+Dox). Three different dose strengths were tested for each treatment. The doses of Dox and Alp were calculated from the loading rate in the approximate proportion of 2:5. b) Live/dead analysis after 24 h culture for MGC803 cells under the six treatments. Green: live cells; Red: dead cells. c) CLSM images (upper panel) and line fluorescence intensity analysis (lower panel) for LP‐ExosAlp+Dox penetration in MGC803 cell spheroids at different time points. d) Volumes of the MGC803 cell spheroids with the six treatments after co‐incubation of 96 h and the typical images for MGC803 cell spheroids. e) Schematic diagram for constructing MGC803‐derived tumor xenografts and the experimental design for the six treatment types (injected into mice via tail vein, and irradiated by 660 nm and 1 W laser for 3 min). f) Evolutions of tumor volumes for MGC803‐derived tumor xenograft treated by six diverse treatments, each group contained six mice. g) Immunohistochemical analysis and quantification of cell proliferation by Ki 67 (upper panel) and cell apoptosis by Cleaved Caspase‐3 (middle panel) and TUNEL (lower panel) in MGC803 tumor tissue at the end of treatment. Positive cells calculated as the percentage of total cells. Data in (a) (n = 3) and (d) (n = 5) represent mean values ± SD. Statistical differences were determined by one‐way ANOVA test. **p < 0.01, **** p < 0.0001.
Figure 6
Figure 6
Personalized anticancer treatments based on LP‐Exos in PDX tumor models. a) Schematic illustration for experiments with CDX model mice. Low‐pH reprogramming applied to cells extracted from subcutaneous xenograft of MGC803‐luciferase nude mice. LP‐Exos released from reprogrammed cells were injected into the CDX mouse via the tail vein to examine tumor‐targeting performance. b) Bioluminescence and fluorescence imaging analyses of MGC803‐luciferase cells and exosomes, respectively, after injection of N‐CDX‐Exos (left panel) and LP‐CDX‐Exos (right panel) into the tail veins of mice bearing CDX tumors. c) Quantitative analysis of the tumor/liver fluorescence intensity (FI) ratio for CDX mice treated with N‐CDX‐Exos and LP‐CDX‐Exos. d) Schematic illustration of the PDX model generation and preparation of low‐pH reprogrammed, dual‐cargos loaded exosomes as anticancer agents: cells obtained from resected human gastric cancer tumor tissues were subcutaneously injected into the backs of mice, and then extracted cells were cultured either with or without low‐pH reprogramming, exosomes released from these cells were loaded with Alp and Dox, and injected into the PDX mouse via the tail vein to examine antitumor effects after laser irradiation. e) PDX tumor volumes after treatment with four diverse treatment types (PBS, Dox, Alp+Dox, LP‐ExosAlp+Dox) (left panel), with terminal weights and tumor images (right panel), each group contained six mice. f) Immunohistochemical analysis of tumor tissues and quantification of cell proliferation by Ki 67 (upper panel) and cell apoptosis by Cleaved Caspase‐3 (middle panel) and TUNEL (lower panel) in MGC803 tumor tissue at the end of treatment. Data in (c), (f) (n = 3), and (e) (n = 6) represent mean values ± SD. Statistical differences in (c) were determined by two‐tailed student's t‐test. Statistical differences in (e) and (f) were determined by one‐way ANOVA test. **p < 0.01, **** p < 0.0001.

Similar articles

Cited by

References

    1. Thery C., Zitvogel L., Amigorena S., Nat. Rev. Immunol. 2002, 2, 569. - PubMed
    1. Tkach M., Thery C., Cell 2016, 164, 1226. - PubMed
    1. Simons M., Raposo G., Curr. Opin. Cell Biol. 2009, 21, 575. - PubMed
    1. Syn N. L., Wang L., Chow E. K., Lim C. T., Goh B. C., Trends Biotechnol. 2017, 35, 665. - PubMed
    1. Farooqi A. A., Desai N. N., Qureshi M. Z., Librelotto D. R. N., Gasparri M. L., Bishayee A., Nabavi S. M., Curti V., Daglia M., Biotechnol. Adv. 2018, 36, 328. - PubMed

Publication types