. 2021 Mar 18;8(10):2003133.
doi: 10.1002/advs.202003133. eCollection 2021 May.

A Dimension Reduction Approach for Energy Landscape: Identifying Intermediate States in Metabolism-EMT Network

Affiliations

A Dimension Reduction Approach for Energy Landscape: Identifying Intermediate States in Metabolism-EMT Network

Xin Kang et al. Adv Sci (Weinh). .

Abstract

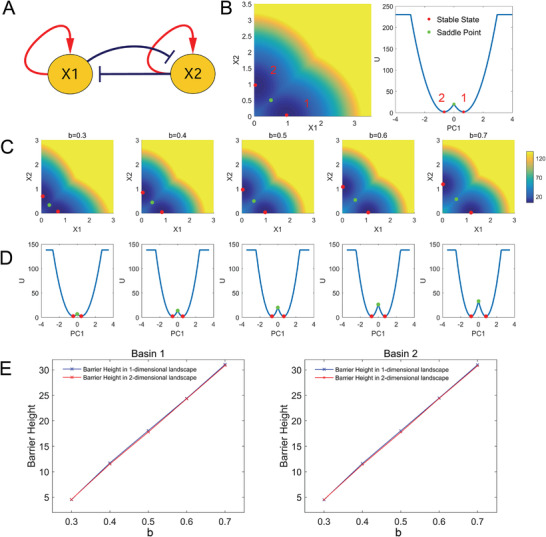
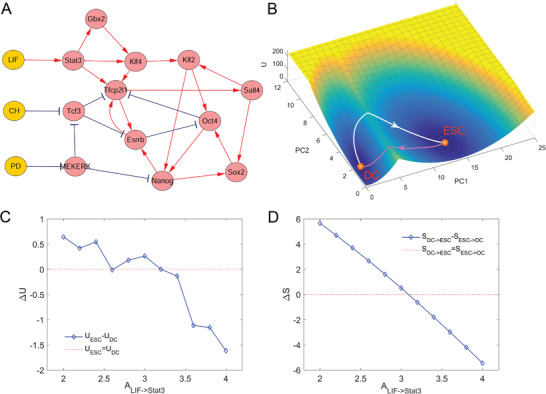
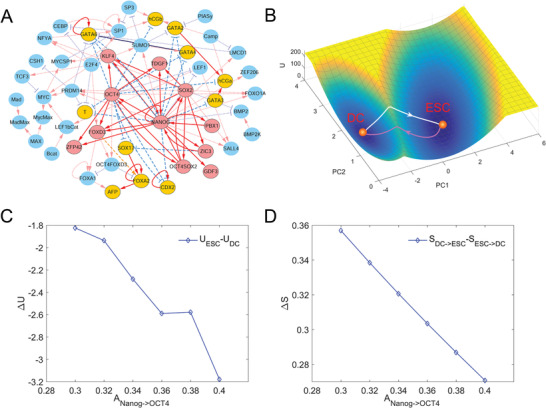
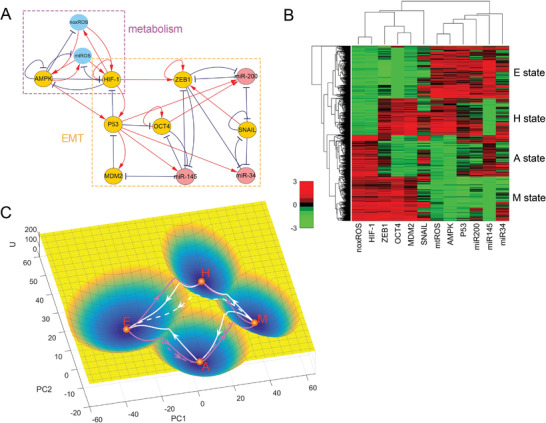
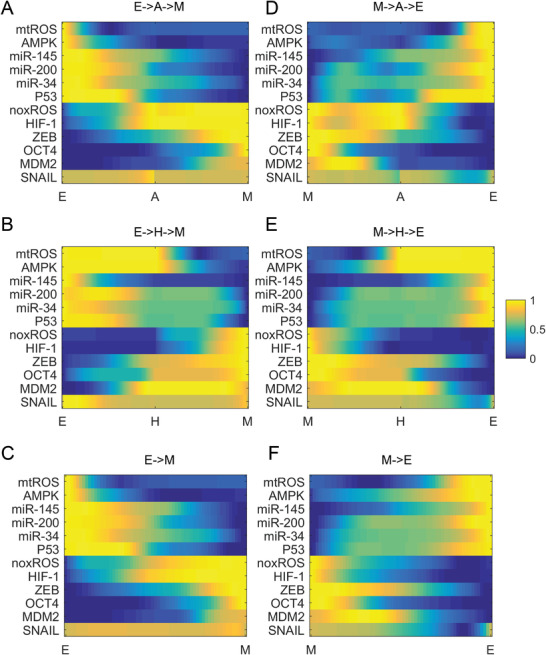
Dimension reduction is a challenging problem in complex dynamical systems. Here, a dimension reduction approach of landscape (DRL) for complex dynamical systems is proposed, by mapping a high-dimensional system on a low-dimensional energy landscape. The DRL approach is applied to three biological networks, which validates that new reduced dimensions preserve the major information of stability and transition of original high-dimensional systems. The consistency of barrier heights calculated from the low-dimensional landscape and transition actions calculated from the high-dimensional system further shows that the landscape after dimension reduction can quantify the global stability of the system. The epithelial-mesenchymal transition (EMT) and abnormal metabolism are two hallmarks of cancer. With the DRL approach, a quadrastable landscape for metabolism-EMT network is identified, including epithelial (E), abnormal metabolic (A), hybrid E/M (H), and mesenchymal (M) cell states. The quantified energy landscape and kinetic transition paths suggest that for the EMT process, the cells at E state need to first change their metabolism, then enter the M state. The work proposes a general framework for the dimension reduction of a stochastic dynamical system, and advances the mechanistic understanding of the underlying relationship between EMT and cellular metabolism.

Keywords: dimension reduction; energy landscape; epithelial‐mesenchymal transitions; gene regulatory networks; transition paths.


Conflict of interest statement

The authors declare no conflict of interest.

Figures

Figure 1
Figure 1
Dimensional reduction for a two‐variable model. A) The network of the MISA model including two nodes. B) Landscapes, stable points, and saddle points shown in original 2D space and 1D space (PC1) after dimension reduction. The contribution rate of PC1 is 95.81%. C) Landscapes, stable points, and saddle points change with parameter b shown in original coordinates. D) Landscapes, stable points, and saddle points change with parameter b shown in PC1 coordinate after dimension reduction. E) The comparisons of barrier heights of each basin changing with parameter b between original 2D landscape and 1D landscape after dimension reduction.
Figure 2
Figure 2
Landscape in reduced dimensions for a MESC network. A) The network of the MESC model including 15 nodes and 26 interaction links (18 activations and 8 inhibitions). Red arrows represent activation and blue perpendicular bars represent inhibition. Orange nodes represent input signals, and red nodes represent genes. B) Landscape and transition paths shown in PC1‐PC2 coordinate. The contribution rates of PC1 and PC2 are 95.52% and 1.15%, respectively. The blue region represents higher probability or lower potential and the yellow region indicates lower probability or higher potential. The white line represents the transition path from DC state to ESC state, and the magenta line represents the transition path from ESC state to DC state. C) The relation between the regulation strength of LIF on Stat3 (ALIFStat3) and the relative barrier heights (difference between UESC and UDC). D) The relation between the regulation strength of LIF on Stat3 (ALIFStat3) and the relative transition actions (difference between SDC>ESC and SESC>DC). ESC, embryonic stem cell state; DC, differentiated cell state.
Figure 3
Figure 3
Landscape in reduced dimensions for a HESC network. A) The network of the HESC model including 52 gene nodes and their interactions (red arrows represent activation and blue perpendicular bars represent inhibition). Red nodes represent 11 marker genes for the pluripotent stem cell state, orange nodes represent 11 marker genes for the differentiation cell state, and cyan nodes represent other genes. The solid links represent the links between marker genes, and the dashed links represent the other links. B) Landscape and transition paths shown in PC1‐PC2 coordinate. The blue region represents higher probability or lower potential and the yellow region indicates lower probability or higher potential. The contribution rates of PC1 and PC2 are 16.91% and 4.17%, respectively. The white line represents the transition path from DC state to ESC state, and the magenta line represents the transition path from ESC state to DC state. C) The relation between the regulation strength of NANOG on OCT4 (ANANOGOCT4) and the relative barrier heights (difference between UESC and UDC). D) The relation between the regulation strength of NANOG on OCT4 (ANANOGOCT4) and the relative transition actions (difference between SDC>ESC and SESC>DC). ESC, embryonic stem cell state; DC, differentiated cell state.
Figure 4
Figure 4
Stable states for a metabolism‐EMT model. A) The network of the metabolism‐EMT model including 12 nodes and 39 interaction links (18 activations and 21 inhibitions). Red arrows represent activation and blue perpendicular bars represent inhibition. Orange nodes represent genes, cyan nodes represent metabolites, and pink nodes represent microRNAs. B) Hierarchical clustering analysis of the stable states from 1000 parameter sets. Each row represents a stable state, and each column represents a gene (or metabolite, microRNA). The stable states can be clustered into four main clusters, which characterize epithelial cell (E), abnormal metabolic cell (A), hybrid E/M cell (H), and mesenchymal cell (M) states, respectively. (C) Landscape and paths shown in PC1‐PC2 coordinate. The contribution rates of PC1 and PC2 are 71.36% and 26.88%, respectively. The blue region represents higher probability or lower potential and the yellow region indicates lower probability or higher potential. Magenta lines represent the transition paths from the E state to M state. White lines represent the transition paths from M state to E state. The solid lines represent indirect paths and the dashed lines represent direct paths. E, epithelial cell state; A, abnormal metabolic cell state; H, hybrid E/M cell state; M, mesenchymal cell state.
Figure 5
Figure 5
The normalized transition paths for the metabolism‐EMT model when the terminal time T=140. Y‐axis represents the 12 genes and X‐axis represents the time points along the transition paths. A,B) The indirect transition path from E state to M state shown for 12 components. D,E) The indirect path from M state to E state shown for 12 components. C,F) The direct transition path between E state and M state shown for 12 components. The yellow regions represent higher expression levels and the blue regions indicate lower expression levels. E, epithelial cell state; A, abnormal metabolic cell state; H, hybrid E/M cell state; M, mesenchymal cell state.
Figure 6
Figure 6
The relative barrier heights (difference between UE and UM) and relative transition actions (difference between SE>M and SM>E) change as regulatory strengths change. A,C,E) show the relative barrier height changes with the self‐activation strength of HIF1 AHIF1HIF1 A), the self‐activation strength of ZEB1 AZEB1ZEB1 C), and the activation of P53 on miR‐145 AP53miR145 E), individually. B,D,F) show the corresponding trend for transition actions. E, epithelial cell state; A, abnormal metabolic cell state; H, hybrid E/M cell state; M, mesenchymal cell state.
Figure 7
Figure 7
Global sensitivity analysis for the parameters based on transition actions for the metabolism‐EMT model. Y‐axis represents the 37 parameters. X‐axis represents the percentage of the change of the transition action (S) relative to S with default parameters. Here, SE>M represents the transition action from E state to M state (magenta bars), and SM>E represents the transition action from M to E state (cyan bars). A) Each parameter is increased by 10%, individually. B) Each parameter is decreased by 10%, individually. E, epithelial cell state, M, mesenchymal cell state.

Similar articles

Cited by

References

    1. Abdi H., Williams L. J., Wiley Interdiscip. Rev.: Comput. Stat. 2010, 2, 433.
    1. Ye J., Janardan R., Li Q., in Advances in Neural Information Processing Systems, MIT Press, Cambridge, MA: 2005, pp. 1569–1576.
    1. Roweis S. T., Saul L. K., Science 2000, 290, 2323. - PubMed
    1. Maaten L. v. d., Hinton G., J. Mach. Learning Res. 2008, 9, 2579.
    1. Pearce P., Woodhouse F. G., Forrow A., Kelly A., Kusumaatmaja H., Dunkel J., Nat. Commun. 2019, 10, 5368. - PMC - PubMed

Publication types

LinkOut - more resources