. 2021 Mar 22;8(10):2003164.
doi: 10.1002/advs.202003164. eCollection 2021 May.

Temporarily Epigenetic Repression in Bergmann Glia Regulates the Migration of Granule Cells

Affiliations

Temporarily Epigenetic Repression in Bergmann Glia Regulates the Migration of Granule Cells

Shaoxuan Chen et al. Adv Sci (Weinh). .

Abstract

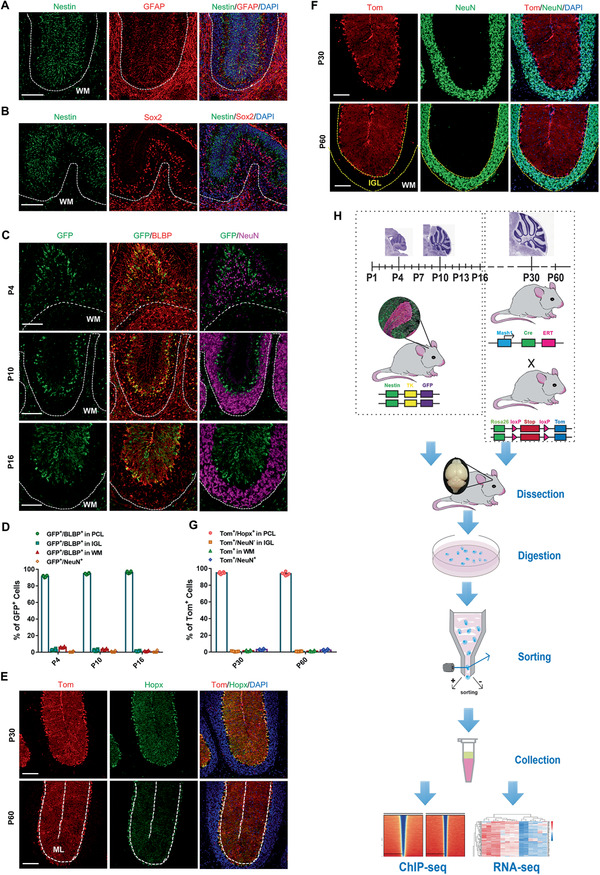
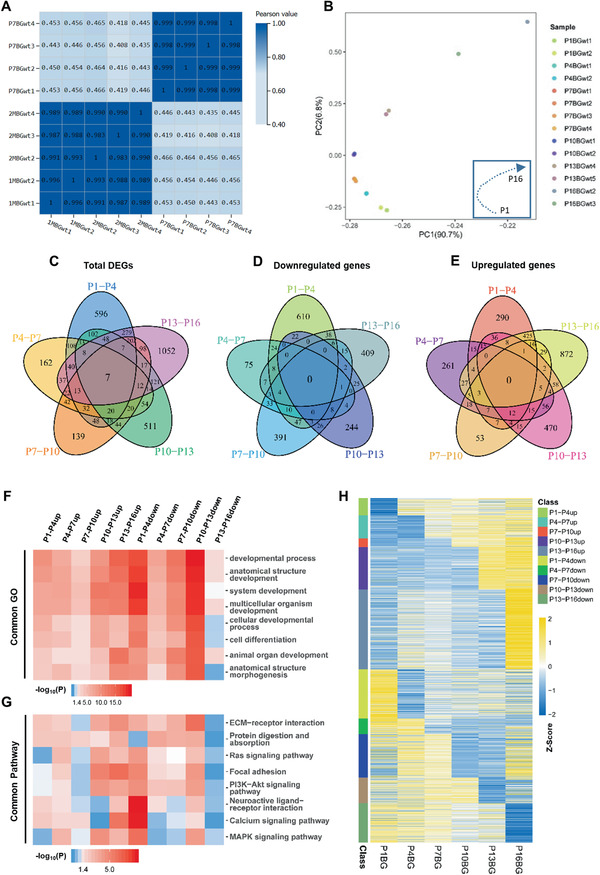
Forming tight interaction with both Purkinje and granule cells (GCs), Bergmann glia (BG) are essential for cerebellar morphogenesis and neuronal homeostasis. However, how BG act in this process is unclear without comprehensive transcriptome landscape of BG. Here, high temporal-resolution investigation of transcriptomes with FACS-sorted BG revealed the dynamic expression of genes within given functions and pathways enabled BG to assist neural migration and construct neuron-glia network. It is found that the peak time of GCs migration (P7-10) strikingly coincides with the downregulation of extracellular matrix (ECM) related genes, and the disruption of which by Setdb1 ablation at P7-10 in BG leads to significant migration defect of GCs emphasizing the criticality of Nfix-Setdb1 mediated H3K9me3 repressive complex for the precise regulation of GCs migration in vivo. Thus, BG's transcriptomic landscapes offer an insight into the mechanism by which BG are in depth integrated in cerebellar neural network.

Keywords: BG development; Bergmann glia; ECM; GC migration; H3K9me3; Nfix; Setdb1.


Conflict of interest statement

The authors declare no conflict of interest.

Figures

Figure 1
Figure 1
Identification of mouse models significantly labeling Bergmann glia. A,B) Co‐immunostaining of Nestin with A) GFAP or B) Sox2 in P7 cerebella, the white matter (WM) was indicated. C,D) Co‐immunostaining of GFP with BLBP or NeuN (C) in NesGFPmouse at the time points as indicated (the WM was indicated). The ratio of different kinds of GFP positive cells at P4, P10, P16 were quantified (D), in which BLBP+ cells in PCL represent BG; BLBP+ cells in IGL and WM are assumed to be astrocytes; and NeuN+ cells refer to GCs. n = 6 sections from 3 mice per time point. E–G) Co‐immunostaining of tdTomato (Tom) with Hopx (E) or NeuN (F) inMash1iTom mice at P30 and P60. The ratio of different kinds of Tom positive cells at P30, P60 were quantified (G), in which Hopx+ cells in PCL represent BG, NeuN+ cells refer to GCs, Tom+ cells in WM and Tom+/NeuN cells in IGL are assumed to be OLs, astrocytes or other type of cells. n = 6 sections from 3 mice per time point. H) The experimental strategy and workflow for BG isolation and next generation sequencing. All the quantification data are presented as mean ± SEM. Scale bars, 100 µm. See also Figure S1, Supporting Information.
Figure 2
Figure 2
Confirming the reliability of Bergmann glia expression profile and obtaining its new marker genes. A) Heatmap to show the expression of marker genes of different kinds of cerebella cells. B) Venn Diagram to show the number of BG putative marker genes for juvenile (P7), young adult (P60), and for both juvenile and young adult. C) Heatmap to exhibit the expression of top 20 unique putative marker genes of juvenile (P7) or young adult (P60) BG and 20 common putative marker genes of juvenile (P7) and young adult (P60) BG. D–F) Immunofluorescence staining to verify the expression of BG new marker genes. D) Co‐staining of a new BG lineage marker Acsbg1 with a well‐established marker BLBP at P7 (The WM was indicated) or E) with Tom (expressed in Mash1iTom mice) at P60. F) Co‐staining of a new marker Rlbp1 unique to juvenile BG with BLBP. Scale bars, 100 µm. G–I) GO analysis on putative marker genes of BG in the juvenile and/or young adult periods as indicated. Data display top 10 enriched GO terms ranked by p values. Color indicates p values for GO term enrichment and circle size indicates the number of enriched genes for each GO term.
Figure 3
Figure 3
Exploring the intrinsic impetus to promote the developmental process of BG. A) Correlation heat map to analyze the similarity of BG transcripts between the juvenile stage (P7) and young adult stages (P30 and P60) with 2–4 repetitions at each time point. The color represents the correlation coefficient (the darker color represents the higher correlation). B) PCA shows the similarity of BG transcripts from P1 to P16 with 2–4 repetitions at each time point. C–E) Venn diagram to analyze the intersection of five adjacent groups (P1–P4, P4–P7, P7–P10, P10–P13, P13–P16) of DEGs. The intersections of C) total DEGs, D) downregulated genes, and E) upregulated genes of each group were shown. F,G) GO and Pathway analysis were performed on up or down regulated genes of the five adjacent stages of BG within P1 to P16, and the top 8 of most common GO (F) or pathway (G) terms were shown in the heatmaps. H) Heatmap to display the successive expression patterns of all up or down regulated genes in (C) from P1 to P16.
Figure 4
Figure 4
Identification of Nfix‐Setdb1 repressive complex for transcriptional repression in BG from P7 to P10. A) Heatmap suggests more genes were repressed rather than upregulated in BG during P7 to P10. The top 5 pathways (ranked by p values) were enriched. B) Time course for genes that most highly express in P7–P10 BG (related to cluster 4 of Figure S5A, Supporting Information), the top5 transcription factors ranked by FPKM are shown in this line chart. C) Co‐staining of Nfix and BLBP for the dynamic expression of Nfix protein in BG at different time points as indicated. D) Scatter plots shows proteins binding to hNFIX or mNfix by MS. E) Co‐immunoprecipitation of endogenous Nfix with Setdb1 from P8 sorted BG. F,G) PLA detects the endogenous binding of Setdb1 with Nfix in P9 cerebella of NesGFP mice (F). The binding of Setdb1 with Trim28 are used as positive control. The red dot signals represent protein binding, and the number of dots in BG cells (G) were counted, two‐tailed unpaired Student's t‐test, ****P < 0.0001, n = 60 BG cells per group. All the quantification data are presented as mean ± SEM. Scale bars, 30 µm.
Figure 5
Figure 5
Setdb1 deficiency of Bergmann glia restrains GCs migration. A,B) Behavior tests were performed on control (Ctrl) and Setdb1mGFAPCKO (Mut) mice at P30 to detect its motor ability (A) with Open Field test, and balance ability (B) with Rotarod test, n = 15 for control and n = 14 for mutant mice. ns, no significance, **P = 0.0034. C) Hematoxylin and eosin (H&E) staining shows the morphology of the control and Setdb1mGFAPCKO cerebella at P15. D,E) Immunostaining for Hopx and BLBP (BG markers) in the control and Setdb1mGFAPCKO cerebella at P7 (the cell bodies of BG were localized in the PCL between the white line) (E), and the density for cell bodies of BG in PCL was quantified (D). ns, no significance, n = 16 sections from 4 mice for each group. F) NeuN staining shows the mature GCs in the control and Setdb1mGFAPCKO cerebella at P15. Arrows point to the ectopic cell mass in the ML in mutant mice. G) Diagram of different layers in Cerebellum. H) Diagram of BrdU pulse‐chase assay. Injection of BrdU at P7 to label proliferating GNPs within EGL. 3 days later, differentiated GNPs (BrdU+ GCs) are migrating to IGL through ML. I,J), NeuN staining shows the mature GCs in the I) Setdb1Atoh1CKO or J) Setdb1Olig1CKO cerebella and their controls at P15. K,L) P27/BrdU staining of cerebellar sections from P10 control and Setdb1mGFAPCKO mice that injected with BrdU at P7 (K). The ratio of BrdU+ cells in IGL (L) was shown, n = 11 for control and n = 7 for mutant mice, ****P < 0.0001. All the quantification data are presented as mean ± SEM, two‐tailed unpaired Student's t‐test. Scale bars, 150 µm.
Figure 6
Figure 6
Nfix‐Setdb1 transcriptional inhibitory complex targets genes that downregulated for GC migration during P7–P10. A) Volcano plot shows DEGs of control (Ctrl) BG versus P10 mutant (Mut) BG. The control BG were sorted from NesGFP mice and the mutant BG were sorted from Setdb1mGFAPCKO‐NesGFP mice. B) The left two columns represent genes that are downregulated in BG during P7–P10. After Setdb1 deletion (the right column), the inhibition of those genes could be reversed (class 1.1 and 1.2), sustained (class 2) or enhanced (class 3). C) Representative top pathway terms enriched in transcripts from class 1.1 which were abnormal regulated genes by loss of Setdb1‐mediated H3K9me3‐binding sites in Setdb1mGFAPCKO BG. D) The de novo Nfix binding motif identified by HOMER derived from class 1.1 genes. E) The up‐regulation of Col18a1 in P10 Setdb1mGFAPCKO BG were confirmed by quantitative real‐time PCR, n = 6 independent experiments. F) Genome browser view of genetic and epigenetic landscapes surrounding the Col18a1 gene locus. Upper panel is an RNA‐seq peak visualization of gene expression from P7 WT, P10 WT, and P10 Mut. Lower panel shows H3K9me3 ChIP‐seq in P10 WT BG and P10 Mut BG. The specific H3K9me3 peaks with de novo Nfix motif in P10 WT BG were highlight in blue. G) Col18a1 staining shows the extracellular signals of Col18a1 in the control and Setdb1mGFAPCKO cerebella at P10. H–J) Using the ex vivo mouse CSC system to test for the effect on GCs migration with or without adding ES peptides which are 20 kDa C‐terminal cleavage product of Col18a1. The experiments were performed as (H). Cerebellar slices were stained for NeuN/BrdU (I). Initial migration ratio of GC (BrdU+ cells in IGL or ML / Total BrdU+ cells) was quantified from left panel of Figure 6I. The final migration ratio of GC (BrdU+ cells in IGL or ML / Total BrdU+ cells) was quantified from Figure 6I, middle and right panel, respectively. New migration ratio of GC = Final migration ratio − Initial migration ratio (J), n = 20 sections from 4 independent CSC for each group. K) Workflow of TMX administration in Setdb1Mash1IKO mice and BrdU pulse‐chase assay. L,M) Cerebellar sections from P10 control and Setdb1Mash1IKO mice were stained for P27/BrdU (L). The ratio of BrdU+ cells in the IGL was quantified, n = 24 sections from 3 mice for each group. 72 h after BrdU‐pulse (M). N) NeuN staining for control and Setdb1Mash1IKO cerebella at P15, arrows point to the ectopic cell mass in the ML. All the quantification data are presented as mean ± SEM, two‐tailed unpaired Student's t‐test, **P < 0.01, ***P < 0.001, ****P < 0.0001. Scale bars, 50 µm

Similar articles

References

    1. Ito M., Prog. Neurobiol. 2006, 78, 272. - PubMed
    1. Buckner R. L., Neuron 2013, 80, 807. - PubMed
    1. Chedotal A., Trends Neurosci. 2010, 33, 163. - PubMed
    1. Millen K. J., Gleeson J. G., Curr. Opin. Neurobiol. 2008, 18, 12. - PMC - PubMed
    1. He L., Yu K., Lu F. H., Wang J. J., Wu L. M. N., Zhao C. T., Li Q. M., Zhou X. Y., Liu H. M., Mu D. Z., Xin M., Qiu M. S., Lu Q. R., J. Neurosci. 2018, 38, 1575. - PMC - PubMed

Publication types

Substances