

Spatial robust fuzzy clustering of COVID 19 time series based on B-splines
- PMID: 34026473
- PMCID: PMC8123527
- DOI: 10.1016/j.spasta.2021.100518
Spatial robust fuzzy clustering of COVID 19 time series based on B-splines
Abstract
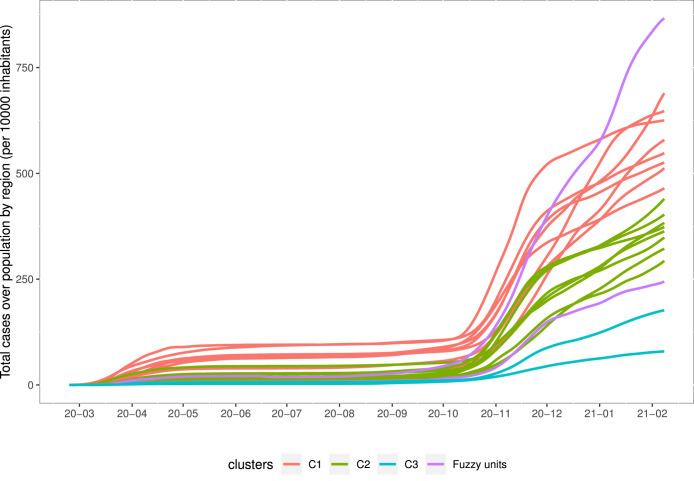
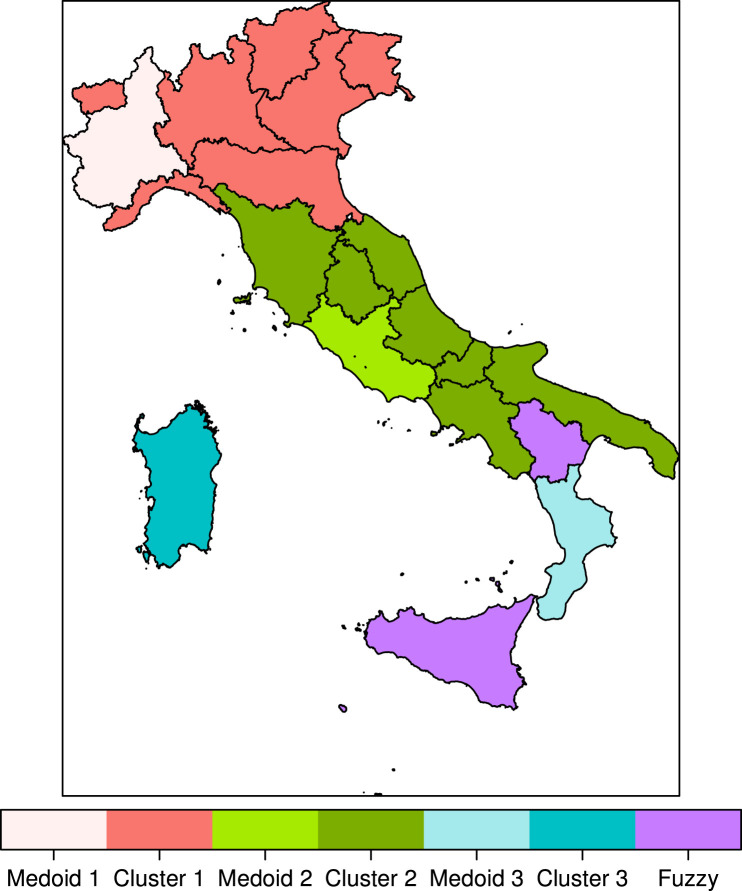
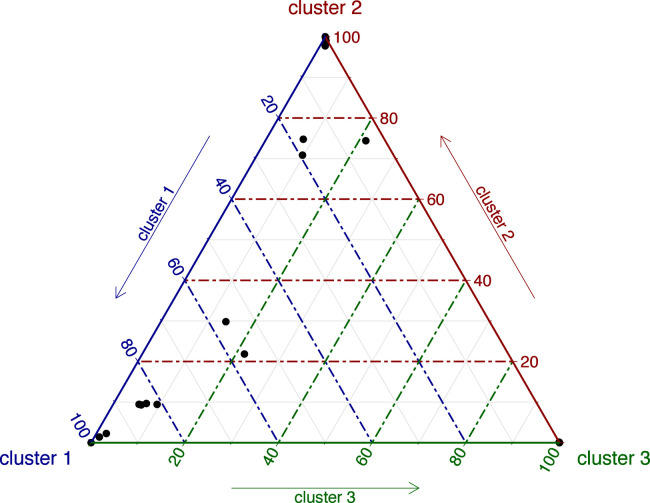
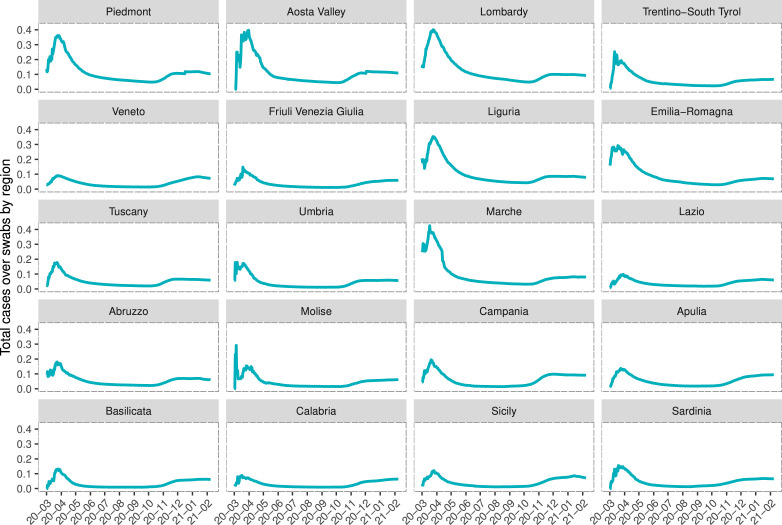
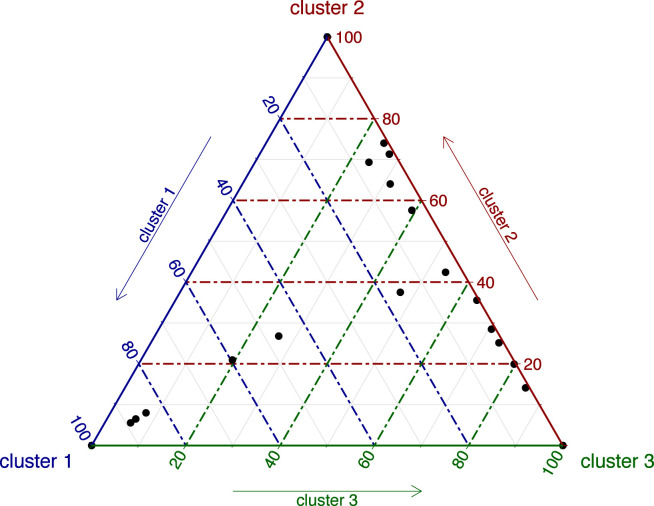
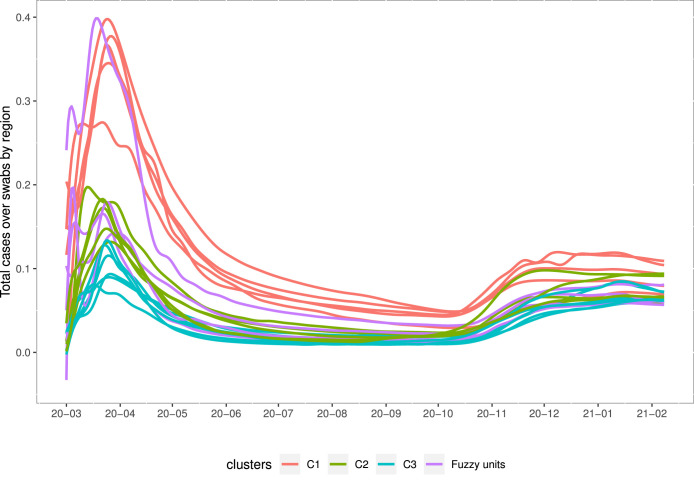
The aim of the work is to identify a clustering structure for the 20 Italian regions according to the main variables related to COVID-19 pandemic. Data are observed over time, spanning from the last week of February 2020 to the first week of February 2021. Dealing with geographical units observed at several time occasions, the proposed fuzzy clustering model embedded both space and time information. Properly, an Exponential distance-based Fuzzy Partitioning Around Medoids algorithm with spatial penalty term has been proposed to classify the spline representation of the time trajectories. The results show that the heterogeneity among regions along with the spatial contiguity is essential to understand the spread of the pandemic and to design effective policies to mitigate the effects.
Keywords: COVID-19; Fuzzy Partitioning Around Medoids; Robust clustering; Spatial clustering; Time series clustering.
© 2021 Published by Elsevier B.V.
Figures


References
-
- Basford K., McLachlan G. The mixture method of clustering applied to three-way data. J. Classification. 1985;2:109–125.
-
- Bezdek J. Kluwer Academic; Norwell, MA, USA: 1981. Pattern Recognition with Fuzzy Objective Function Algorithms.
-
- Birant D., Kut A. ST-DBSCAN: An algorithm for clustering spatial-temporal data. Data Knowl. Eng. 2007;60:208–221.
-
- de Boor C. Springer; 2001. A Practical Guide to Splines.
-
- Campello R., Hruschka E. A fuzzy extension of the silhouette width criterion for cluster analysis. Fuzzy Sets and Systems. 2006;157:2858–2875.
LinkOut - more resources
Full Text Sources
Other Literature Sources