

Essential Genes and MiRNA-mRNA Network Contributing to the Pathogenesis of Idiopathic Pulmonary Arterial Hypertension
- PMID: 34026864
- PMCID: PMC8133434
- DOI: 10.3389/fcvm.2021.627873
Essential Genes and MiRNA-mRNA Network Contributing to the Pathogenesis of Idiopathic Pulmonary Arterial Hypertension
Abstract
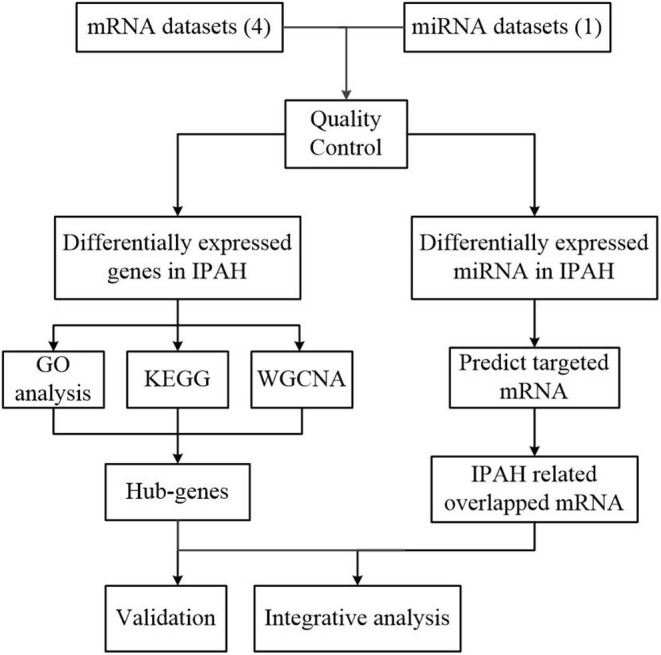
Background: Idiopathic pulmonary arterial hypertension (IPAH) is a life-threatening disease. Owing to its high fatality rate and narrow therapeutic options, identification of the pathogenic mechanisms of IPAH is becoming increasingly important. Methods: In our research, we utilized the robust rank aggregation (RRA) method to integrate four eligible pulmonary arterial hypertension (PAH) microarray datasets and identified the significant differentially expressed genes (DEGs) between IPAH and normal samples. Gene Ontology (GO) and Kyoto Encyclopedia of Genes and Genomes (KEGG) pathways were performed to analyze their functions. The interaction network of protein-protein interaction (PPI) was constructed to explore the correlation between these DEGs. The functional modules and hub genes were further identified by the weighted gene coexpression network analysis (WGCNA). Moreover, a miRNA microarray dataset was involved and analyzed to filter differentially expressed miRNAs (DE-miRNAs). Potential target genes of screened DE-miRNAs were predicted and merged with DEGs to explore a miRNA-mRNA network in IPAH. Some hub genes were selected and validated by RT-PCR in lung tissues from the PAH animal model. Results: A total of 260 DEGs, consisting of 183 upregulated and 77 downregulated significant DEGs, were identified, and some of those genes were novel. Their molecular roles in the etiology of IPAH remained vague. The most crucial functional module involved in IPAH is mainly enriched in biological processes, including leukocyte migration, cell chemotaxis, and myeloid leukocyte migration. Construction and analysis of the PPI network showed that CXCL10, CXCL9, CCR1, CX3CR1, CX3CL1, CXCR2, CXCR1, PF4, CCL4L1, and ADORA3 were recognized as top 10 hub genes with high connectivity degrees. WGCNA further identified five main functional modules involved in the pathogenesis of IPAH. Twelve upregulated DE-miRNAs and nine downregulated DE-miRNAs were identified. Among them, four downregulated DEGs and eight upregulated DEGs were supposed to be negatively regulated by three upregulated DE-miRNAs and three downregulated DE-miRNAs, respectively. Conclusions: This study identifies some key and functional coexpression modules involved in IPAH, as well as a potential IPAH-related miRNA-mRNA regulated network. It provides deepening insights into the molecular mechanisms and provides vital clues in seeking novel therapeutic targets for IPAH.
Keywords: GEO; hub genes; idiopathic pulmonary arterial hypertension; lung tissues; microRNA.
Copyright © 2021 Hao, Jiang, Xie, Xiang, Liu, Hu, Wu, Jiang, Xiao and Li.
Conflict of interest statement
The authors declare that the research was conducted in the absence of any commercial or financial relationships that could be construed as a potential conflict of interest.
Figures


Similar articles
-
Comprehensive Analyses of miRNA-mRNA Network and Potential Drugs in Idiopathic Pulmonary Arterial Hypertension.Biomed Res Int. 2020 Jul 3;2020:5156304. doi: 10.1155/2020/5156304. eCollection 2020. Biomed Res Int. 2020. PMID: 32714978 Free PMC article.
-
Identification of Hub Genes and MicroRNAs Associated With Idiopathic Pulmonary Arterial Hypertension by Integrated Bioinformatics Analyses.Front Genet. 2021 Apr 29;12:667406. doi: 10.3389/fgene.2021.636934. eCollection 2021. Front Genet. 2021. PMID: 33995494 Free PMC article.
-
Construction of Potential Glioblastoma Multiforme-Related miRNA-mRNA Regulatory Network.Front Mol Neurosci. 2019 Mar 26;12:66. doi: 10.3389/fnmol.2019.00066. eCollection 2019. Front Mol Neurosci. 2019. PMID: 30971889 Free PMC article.
-
In silico Analysis Excavates A Novel Competing Endogenous RNA Subnetwork in Adolescent Idiopathic Scoliosis.Front Med (Lausanne). 2020 Oct 28;7:583243. doi: 10.3389/fmed.2020.583243. eCollection 2020. Front Med (Lausanne). 2020. PMID: 33195333 Free PMC article.
-
Autoimmunity in Pulmonary Arterial Hypertension: Evidence for Local Immunoglobulin Production.Front Cardiovasc Med. 2021 Sep 21;8:680109. doi: 10.3389/fcvm.2021.680109. eCollection 2021. Front Cardiovasc Med. 2021. PMID: 34621794 Free PMC article. Review.
Cited by
-
Weighted gene co-expression network analysis identifies dysregulated B-cell receptor signaling pathway and novel genes in pulmonary arterial hypertension.Front Cardiovasc Med. 2022 Oct 6;9:909399. doi: 10.3389/fcvm.2022.909399. eCollection 2022. Front Cardiovasc Med. 2022. PMID: 36277750 Free PMC article.
-
Identification of ACKR4 as an immune checkpoint in pulmonary arterial hypertension.Front Immunol. 2023 Jun 28;14:1153573. doi: 10.3389/fimmu.2023.1153573. eCollection 2023. Front Immunol. 2023. PMID: 37449198 Free PMC article.
-
Inhibition of miR-4640-5p alleviates pulmonary hypertension in chronic obstructive pulmonary disease patients by regulating nitric oxide synthase 1.Respir Res. 2023 Mar 24;24(1):92. doi: 10.1186/s12931-023-02387-5. Respir Res. 2023. PMID: 36964568 Free PMC article.
-
Role of microRNA-34b-5p in cancer and injury: how does it work?Cancer Cell Int. 2022 Dec 1;22(1):381. doi: 10.1186/s12935-022-02797-3. Cancer Cell Int. 2022. PMID: 36457043 Free PMC article. Review.
-
Connections for Matters of the Heart: Network Medicine in Cardiovascular Diseases.Front Cardiovasc Med. 2022 May 19;9:873582. doi: 10.3389/fcvm.2022.873582. eCollection 2022. Front Cardiovasc Med. 2022. PMID: 35665246 Free PMC article. Review.
References
-
- “2015 ESC/ERS Guidelines for the diagnosis and treatment of pulmonary hypertension . The Joint Task Force for the Diagnosis and Treatment of Pulmonary Hypertension of the European Society of Cardiology (ESC) and the European Respiratory Society (ERS).” Nazzareno Galiè, Marc Humbert, Jean-Luc Vachiery, Simon Gibbs, Irene Lang, Adam Torbicki, Gérald Simonneau, Andrew Peacock, Anton Vonk Noordegraaf, Maurice Beghetti, Ardeschir Ghofrani, Miguel Angel Gomez Sanchez, Georg Hansmann, Walter Klepetko, Patrizio Lancellotti, Marco Matucci, Theresa McDonagh, Luc A. Pierard, Pedro T. Trindade, Maurizio Zompatori and Marius Hoeper. Eur Respir J 2015; 46: 903-975. Eur Respir J. (2015) 46:1855–6. 10.1183/13993003.51032-2015 - DOI - PubMed
LinkOut - more resources
Full Text Sources
Research Materials
Miscellaneous