

UPLC-MS-Based Serum Metabolomics Reveals Potential Biomarkers of Ang II-Induced Hypertension in Mice
- PMID: 34026879
- PMCID: PMC8131677
- DOI: 10.3389/fcvm.2021.683859
UPLC-MS-Based Serum Metabolomics Reveals Potential Biomarkers of Ang II-Induced Hypertension in Mice
Abstract
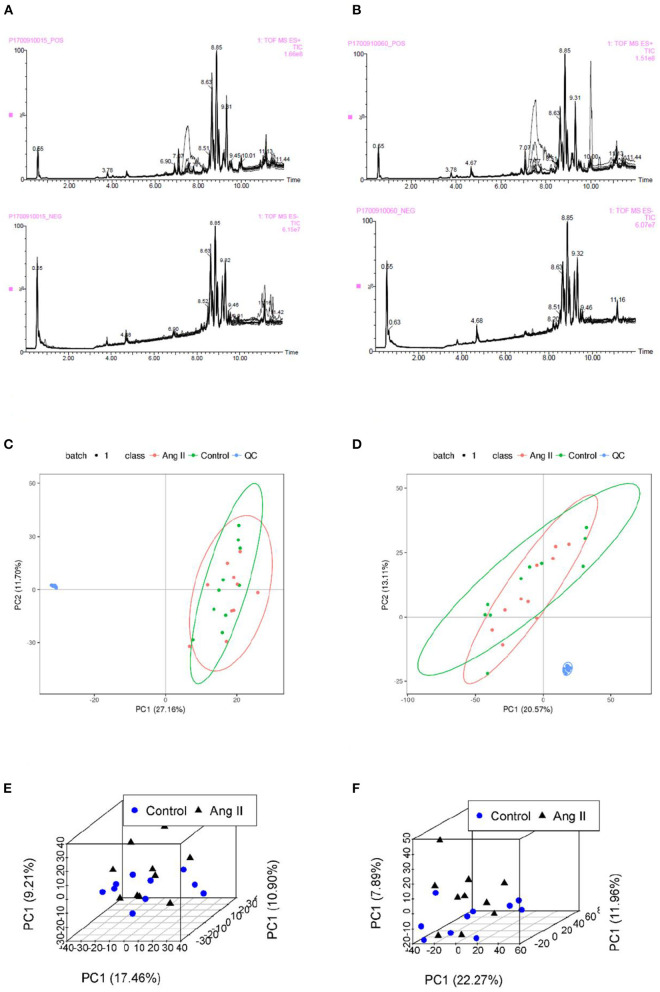
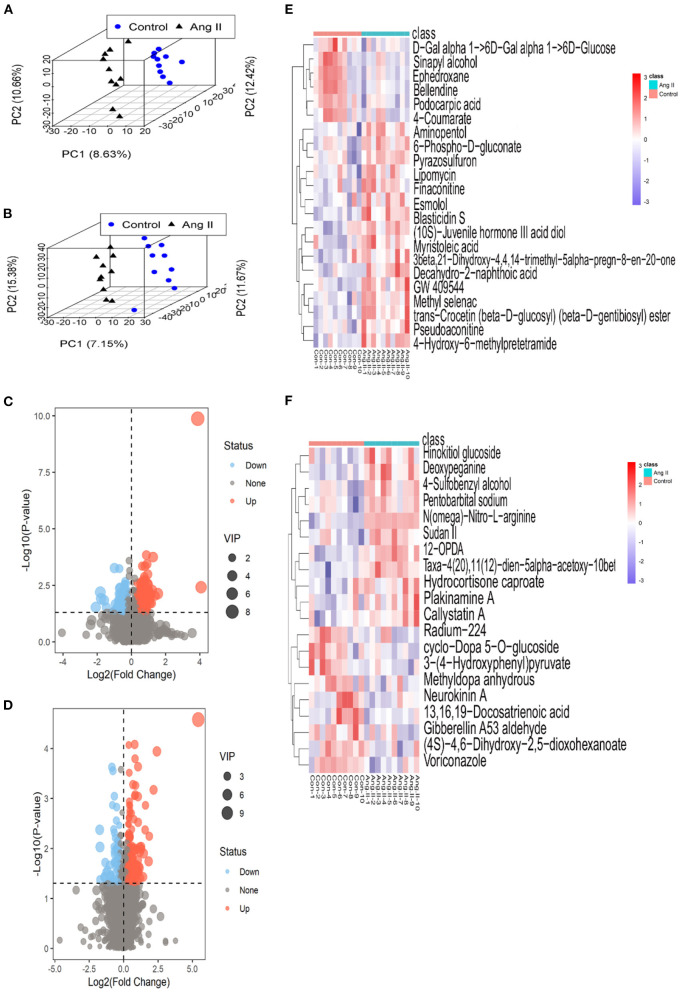
Hypertension is caused by polygenic inheritance and the interaction of various environmental factors. Abnormal function of the renin-angiotensin-aldosterone system (RAAS) is closely associated with changes in blood pressure. As an essential factor in the RAAS, angiotensin II (Ang II) contributes to vasoconstriction and inflammatory responses. However, the effects of overproduction of Ang II on the whole body-metabolism have been unclear. In this study, we established a hypertensive mouse model by micro-osmotic pump perfusion of Ang II, and the maximum systolic blood pressure reached 140 mmHg after 2 weeks. By ultra-performance liquid chromatography-quadrupole time-of-flight mass spectrometry, the metabolites in the serum of hypertensive model and control mice were analyzed. Partial least squares discriminant analysis (PLS-DA) in both positive and negative ionization modes showed clear separation of the two groups. Perfusion of Ang II induced perturbations of multiple metabolic pathways in mice, such as steroid hormone biosynthesis and galactose metabolism. Tandem mass spectrometry revealed 40 metabolite markers with potential diagnostic value for hypertension. Our data indicate that non-targeted metabolomics can reveal biochemical pathways associated with Ang II-induced hypertension. Although researches about the clinical use of these metabolites as potential biomarkers in hypertension is still needed, the current study improves the understanding of systemic metabolic response to sustained release of Ang II in hypertensive mice, providing a new panel of biomarkers that may be used to predict blood pressure fluctuations in the early stages of hypertension.
Keywords: LC-MS; angiotensin II; biomarkers; hypertension; metabolomics; mice; serum metabolites.
Copyright © 2021 Yang, Wang, Guo, Du, Wen, Geng, Yu, Liu, Li, Feng and Zhou.
Conflict of interest statement
The authors declare that the research was conducted in the absence of any commercial or financial relationships that could be construed as a potential conflict of interest.
Figures


Similar articles
-
Ambient fine particulate matter induced the elevation of blood pressure through ACE2/Ang(1-7) pathway: The evidence from urine metabolites.Ecotoxicol Environ Saf. 2020 Oct 15;203:111044. doi: 10.1016/j.ecoenv.2020.111044. Epub 2020 Jul 21. Ecotoxicol Environ Saf. 2020. PMID: 32888613
-
Identification of essential hypertension biomarkers in human urine by non-targeted metabolomics based on UPLC-Q-TOF/MS.Clin Chim Acta. 2018 Nov;486:192-198. doi: 10.1016/j.cca.2018.08.006. Epub 2018 Aug 7. Clin Chim Acta. 2018. PMID: 30092170 Clinical Trial.
-
Hypertension: renin-angiotensin-aldosterone system alterations.Circ Res. 2015 Mar 13;116(6):960-75. doi: 10.1161/CIRCRESAHA.116.303587. Circ Res. 2015. PMID: 25767283 Review.
-
Pharmacodynamics and metabonomics study of Tianma Gouteng Decoction for treatment of spontaneously hypertensive rats with liver-yang hyperactivity syndrome.J Ethnopharmacol. 2020 May 10;253:112661. doi: 10.1016/j.jep.2020.112661. Epub 2020 Feb 11. J Ethnopharmacol. 2020. PMID: 32058006
-
Angiotensin II reactivation and aldosterone escape phenomena in renin-angiotensin-aldosterone system blockade: is oral renin inhibition the solution?Expert Opin Pharmacother. 2007 Apr;8(5):529-35. doi: 10.1517/14656566.8.5.529. Expert Opin Pharmacother. 2007. PMID: 17376010 Review.
Cited by
-
Hypertension inhibition by Dubosiella newyorkensis via reducing pentosidine synthesis.NPJ Biofilms Microbiomes. 2025 Feb 22;11(1):34. doi: 10.1038/s41522-025-00645-6. NPJ Biofilms Microbiomes. 2025. PMID: 39987250 Free PMC article.
-
Probiotics Bifidobacterium lactis M8 and Lactobacillus rhamnosus M9 prevent high blood pressure via modulating the gut microbiota composition and host metabolic products.mSystems. 2023 Dec 21;8(6):e0033123. doi: 10.1128/msystems.00331-23. Epub 2023 Oct 19. mSystems. 2023. PMID: 37855616 Free PMC article.
References
-
- Granger JP, Schnackenberg CG. Renal mechanisms of angiotensin II-induced hypertension. Semin Nephrol. (2000) 20:417–25. - PubMed
LinkOut - more resources
Full Text Sources
Research Materials
Miscellaneous