

Health impacts of climate change on smallholder farmers
- PMID: 34027006
- PMCID: PMC8122118
- DOI: 10.1016/j.onehlt.2021.100258
Health impacts of climate change on smallholder farmers
Abstract
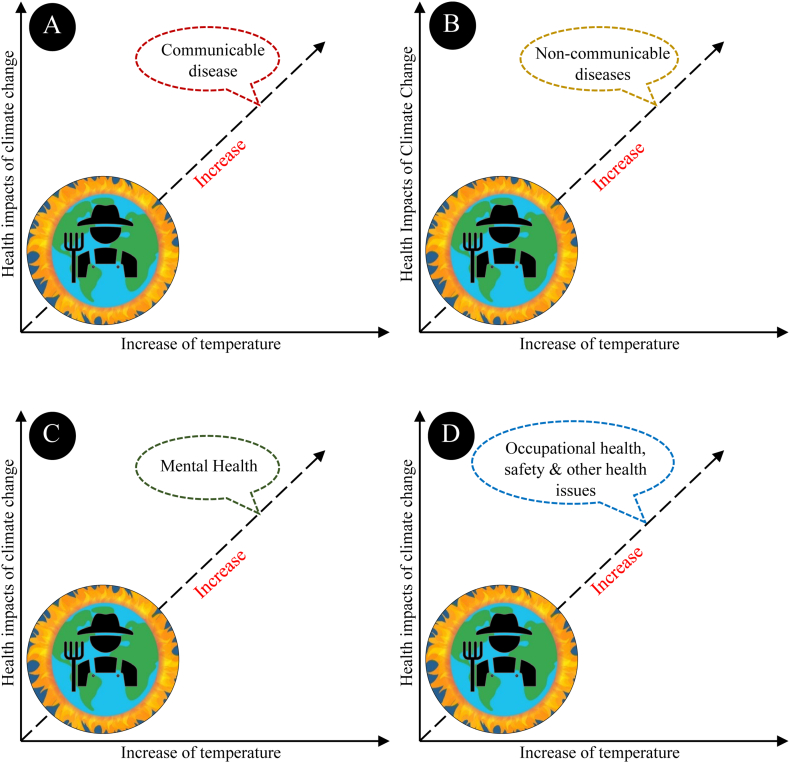
The health of smallholder farmers is crucial for ensuring food and nutritional security for two billion people. However, their health is in jeopardy for several reasons including challenges from climate change impacts. Using a narrative literature review supported by field observations and informal interviews with key informants in India, Bangladesh and Malawi, this paper identifies and discusses the health impacts of climate change under four categories: (i) communicable diseases, (ii) non-communicable diseases, (iii) mental health, and (iv) occupational health, safety and other health issues. The health impacts of climate change on smallholder farmers will hamper the realization of many of the United Nations' Sustainable Development Goals, and a series of recommendations are made to regional and country governments to address the increasing health impacts of accelerating climate change among smallholder farmers.
Keywords: Climate change; Health impacts; SDGs; Smallholder farmers.
© 2021 The Author(s).
Conflict of interest statement
The authors declare no conflict of interest.
Figures
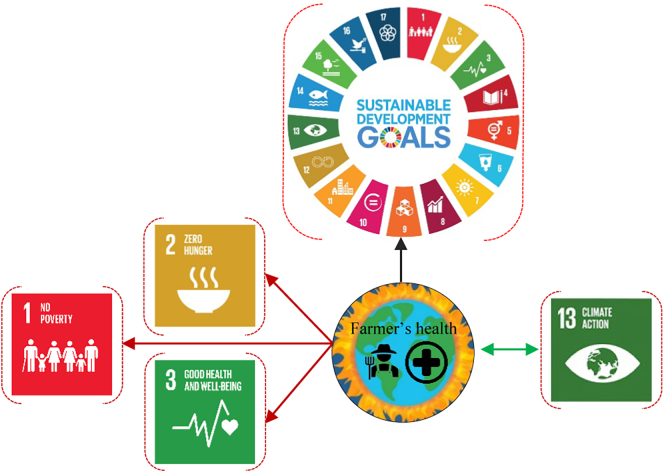
 ) indicates reverse impacts, which means climate action [SDG:15] will reduce the health impacts of climate change on smallholder farmers. Red arrow (
 ) indicates smallholder farmers' health impact of climate change will have serious negative impacts on achiving SDGs: 1, 2 & 3. Note: In the diagram SGD 1: No Poverty, SGD 2: Zero Hunger, SGD 3: Good Health and Well-being, SGD 4: Quality Education, SGD 5: Gender Equality, SGD 6: Clean Water and Sanitation, SGD 7: Affordable and Clean Energy, SGD 8: Decent Work and Economic Growth, SGD 9: Industry, Innovation and Infrastructure, SGD 10: Reducing Inequality, SGD 11: Sustainable Cities and Communities, SGD 12: Responsible Consumption and Production, SGD 13: Climate Action, SGD 14: Life Below Water, SGD 15: Life On Land, SGD 16: Peace, Justice, and Strong Institutions, SGD 17: Partnerships for the Goals. (For interpretation of the references to colour in this figure legend, the reader is referred to the web version of this article.)
References
-
- Ricciardi V., Ramankutty N., Mehrabi Z., Jarvis L., Chookolingo B. How much of the world's food do smallholders produce? Glob. Food Security. 2018;17:64–72. doi: 10.1016/j.gfs.2018.05.002. - DOI
-
- Khalil C.A., Conforti P., Ergin I., Gennari P. Food Agric. Org. United Nations; 2017. Defining Small-scale Food Producers to Monitor Target 2.3. Of the 2030 Agenda for Sustainable Development; p. 17.http://www.fao.org/3/i6858e/i6858e.pdf
-
- Lowder S.K., Skoet J., Raney T. The number, size, and distribution of farms, smallholder farms, and family farms worldwide. World Dev. 2016;87:16–29. doi: 10.1016/j.worlddev.2015.10.041. - DOI
-
- WB . World Bank; 2016. A Year in the Lives of Smallholder Farmers.https://www.worldbank.org/en/news/feature/2016/02/25/a-year-in-the-lives...
Publication types
LinkOut - more resources
Full Text Sources
Other Literature Sources
