

Describing socio-economic variation in life expectancy according to an individual's education, occupation and wage in England and Wales: An analysis of the ONS Longitudinal Study
- PMID: 34027013
- PMCID: PMC8131985
- DOI: 10.1016/j.ssmph.2021.100815
Describing socio-economic variation in life expectancy according to an individual's education, occupation and wage in England and Wales: An analysis of the ONS Longitudinal Study
Abstract
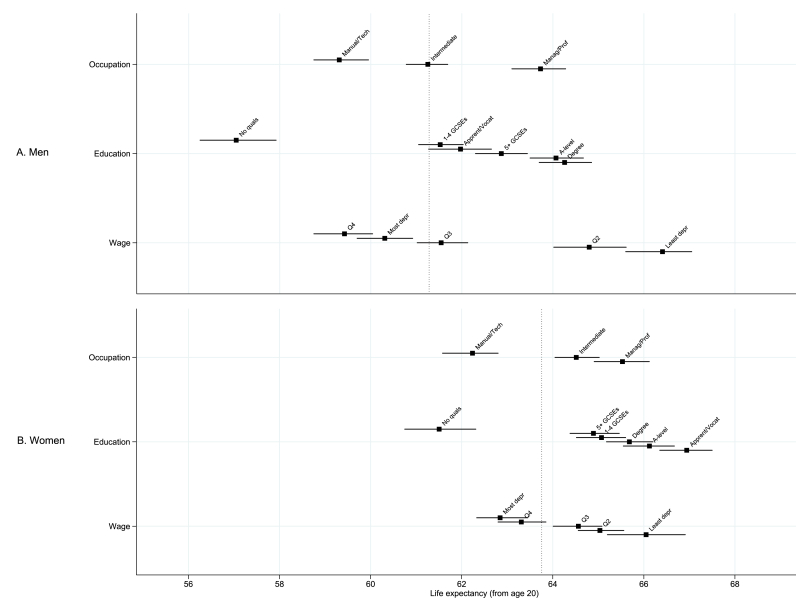
People who live in more deprived areas have poorer health outcomes, and this inequality is a major driver of health and social policy. Many interventions targeting these disparities implicitly assume that poorer health is predominantly associated with area-level factors, and that these inequalities are the same for men and women. However, health differentials due to individual socio-economic status (SES) of men and women are less well documented. We used census data linked to the ONS Longitudinal Study to derive individual-level SES in terms of occupation, education and estimated wage, and examined differences in adult mortality and life expectancy. We modelled age-, sex- and SES-specific mortality using Poisson regression, and summarised mortality differences using life expectancy at age 20. We compared the results to those calculated using area-level deprivation metrics. Wide inequalities in life expectancy between SES groups were observed, although differences across SES groups were smaller for women than for men. The widest inequalities were found across men's education (7.2-year (95% CI: 3.0-10.1) difference in life expectancy between groups) and wage (7.0-year (95% CI: 3.5-9.8) difference), and women's education (5.4-year (95% CI: 2.2-8.1) difference). Men with no qualifications had the lowest life expectancy of all groups. In terms of the number of years' difference in life expectancy, the inequalities measured here with individual-level data were of a similar magnitude to inequalities identified previously using area-level deprivation metrics. These data show that health inequalities are as strongly related to individual SES as to area-level deprivation, highlighting the complementary usefulness of these different metrics. Indeed, poor outcomes are likely to be a product of both community and individual influences. Current policy which bases health spending decisions on evidence of inequalities between geographical areas may overlook individual-level SES inequalities for those living in affluent areas, as well as missing important sex differences.
Keywords: Census data; Educational status; Income; Life expectancy; Mortality; Occupational groups; Socio-economic status.
© 2021 The Author(s).
Conflict of interest statement
None to declare.
Figures
Similar articles
-
An investigation of cancer survival inequalities associated with individual-level socio-economic status, area-level deprivation, and contextual effects, in a cancer patient cohort in England and Wales.BMC Public Health. 2022 Jan 13;22(1):90. doi: 10.1186/s12889-022-12525-1. BMC Public Health. 2022. PMID: 35027042 Free PMC article.
-
Assessing the contribution of alcohol-specific causes to socio-economic inequalities in mortality in England and Wales 2001-16.Addiction. 2020 Dec;115(12):2268-2279. doi: 10.1111/add.15037. Epub 2020 Mar 31. Addiction. 2020. PMID: 32237009 Free PMC article.
-
Deriving trends in life expectancy by the National Statistics Socioeconomic Classification using the ONS Longitudinal Study.Health Stat Q. 2011 Spring;(49):9-51. doi: 10.1057/hsq.2011.2. Health Stat Q. 2011. PMID: 21372844
-
Folic acid supplementation and malaria susceptibility and severity among people taking antifolate antimalarial drugs in endemic areas.Cochrane Database Syst Rev. 2022 Feb 1;2(2022):CD014217. doi: 10.1002/14651858.CD014217. Cochrane Database Syst Rev. 2022. PMID: 36321557 Free PMC article.
-
Socio-economic inequalities in fragility fracture outcomes: a systematic review and meta-analysis of prognostic observational studies.Osteoporos Int. 2020 Jan;31(1):31-42. doi: 10.1007/s00198-019-05143-y. Epub 2019 Aug 30. Osteoporos Int. 2020. PMID: 31471664
Cited by
-
Are deprivation-specific cancer survival patterns similar according to individual-based and area-based measures? A cohort study of patients diagnosed with five malignancies in England and Wales, 2008-2016.BMJ Open. 2022 Jun 10;12(6):e058411. doi: 10.1136/bmjopen-2021-058411. BMJ Open. 2022. PMID: 35688589 Free PMC article.
-
Association between income, employment status, and asthma outcomes: a systematic review and meta-analysis.Lancet Reg Health Eur. 2025 Jun 26;56:101367. doi: 10.1016/j.lanepe.2025.101367. eCollection 2025 Sep. Lancet Reg Health Eur. 2025. PMID: 40688041 Free PMC article.
-
Methods of assessing value for money of UK-based early childhood public health interventions: a systematic literature review.Br Med Bull. 2023 Apr 5;145(1):88-109. doi: 10.1093/bmb/ldac035. Br Med Bull. 2023. PMID: 36542119 Free PMC article. Review.
-
The impact of ageing, socio-economic differences and the evolution of morbidity on future health expenditure - a dynamic microsimulation.BMC Health Serv Res. 2025 Jul 12;25(1):952. doi: 10.1186/s12913-025-13072-2. BMC Health Serv Res. 2025. PMID: 40652199 Free PMC article.
-
How aging of the global population is changing oncology.Ecancermedicalscience. 2021 Dec 13;15:ed119. doi: 10.3332/ecancer.2021.ed119. eCollection 2021. Ecancermedicalscience. 2021. PMID: 35211208 Free PMC article.
References
-
- Banks J., Nazroo J., Steptoe A. The Institute for Fiscal Studies; London: 2014. The dynamics of ageing: Evidence from the English longitudinal study of ageing.
-
- Butler D.C., Petterson S., Bazemore A., Douglas K.A. Use of measures of socioeconomic deprivation in planning primary health care workforce and defining health care need in Australia. Australian Journal of Rural Health. 2010;18:199–204. - PubMed
-
- Centre for Longitudinal Study Information and User Support . 2020. Data dictionary.https://www.ucl.ac.uk/infostudies/silva-php-resources/researchProjects/c...
-
- Charvat H., Remontet L., Bossard N. A multilevel excess hazard model to estimate net survival on hierarchical data allowing for non-linear and non-proportional effects of covariates. Statistics in Medicine. 2016;35:3066–3084. - PubMed
Grants and funding
LinkOut - more resources
Full Text Sources
Other Literature Sources
