. 2021 May:18:100159.
doi: 10.1016/j.comtox.2021.100159.

Assessment of the predictive capacity of a physiologically based kinetic model using a read-across approach

Affiliations

Assessment of the predictive capacity of a physiologically based kinetic model using a read-across approach

Alicia Paini et al. Comput Toxicol. 2021 May.

Abstract

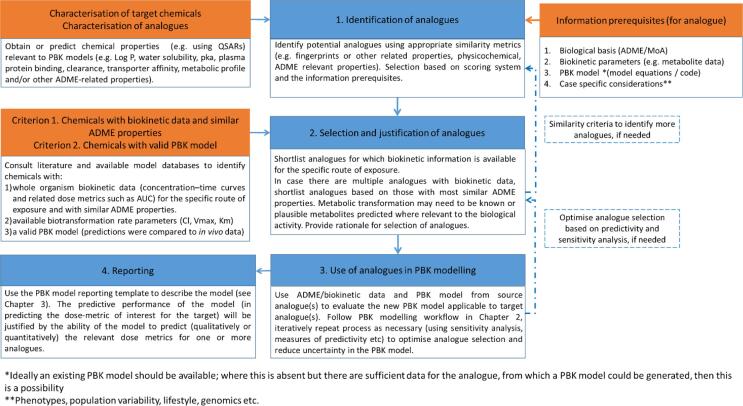
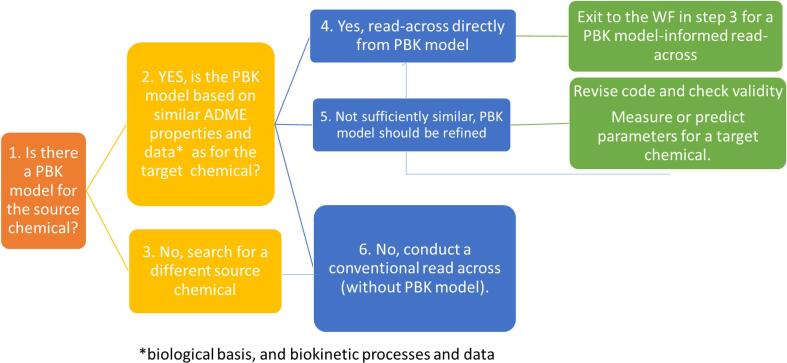
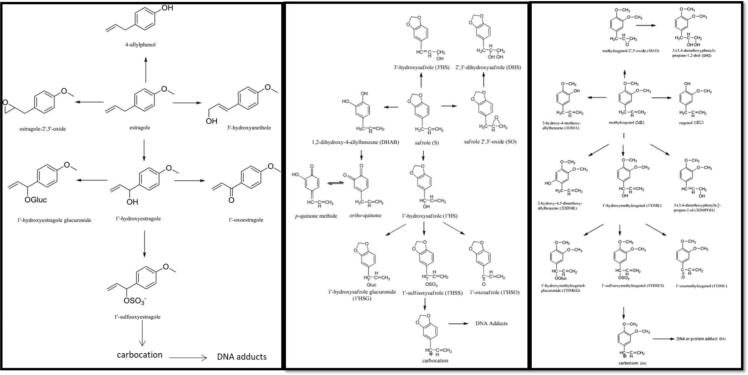
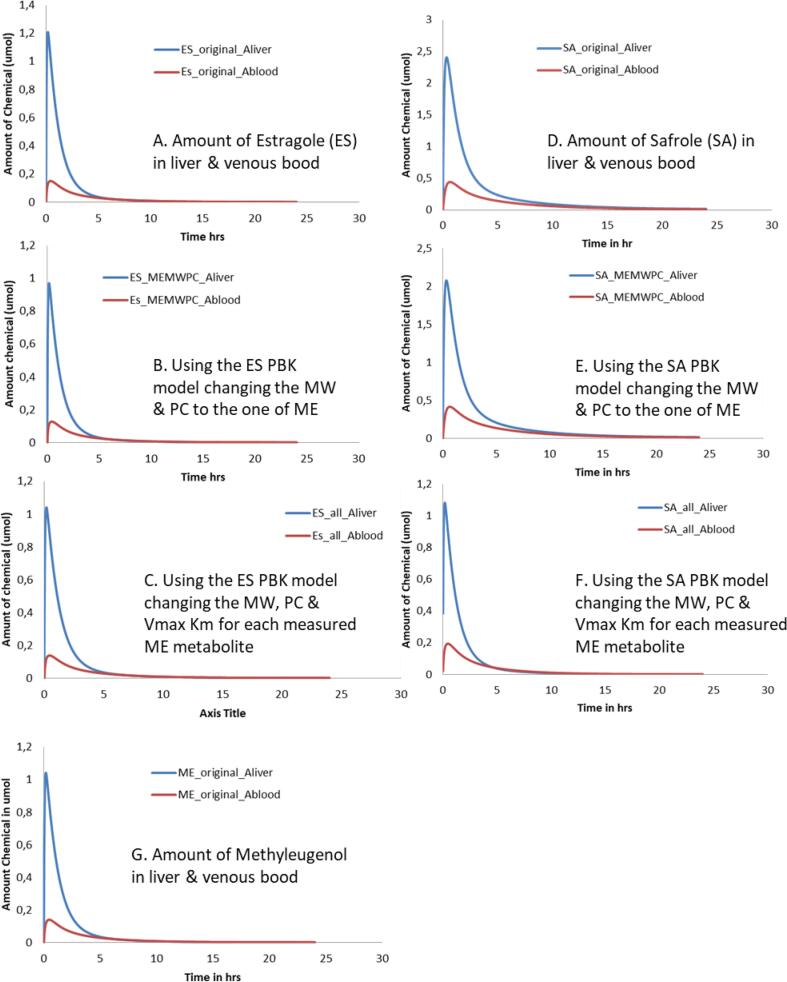
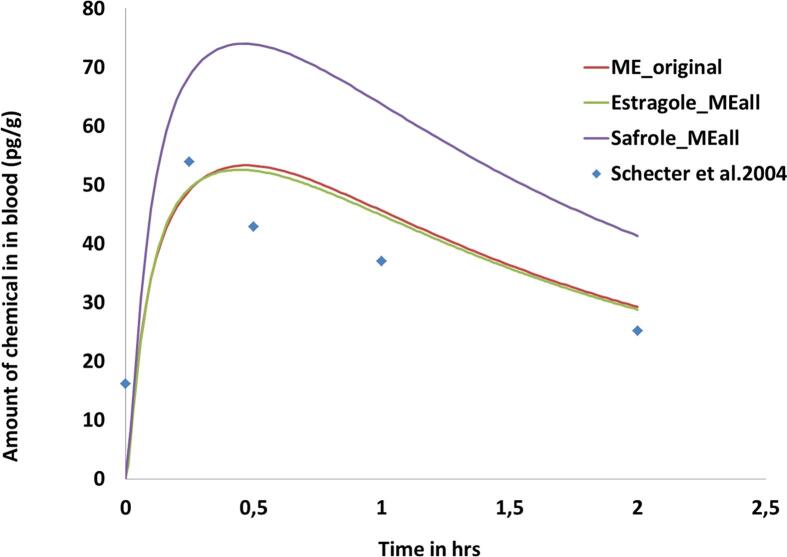
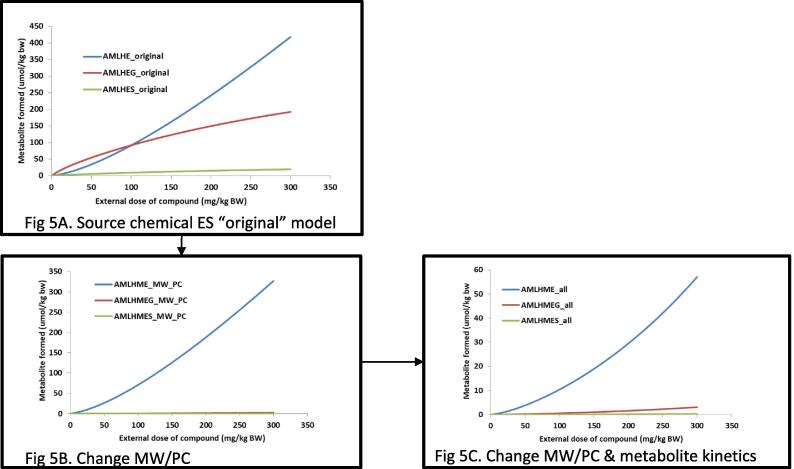
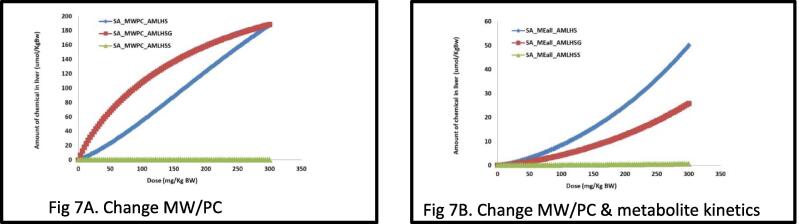
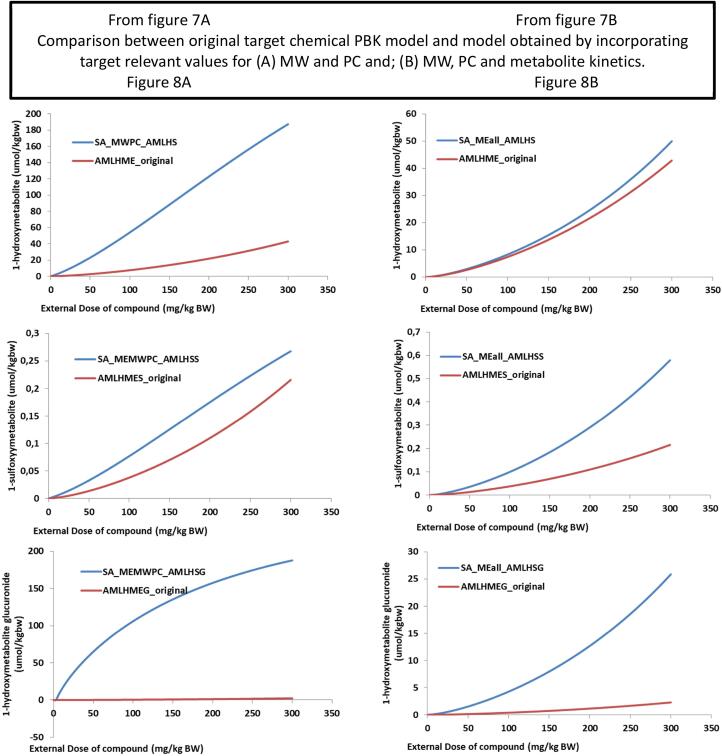
With current progress in science, there is growing interest in developing and applying Physiologically Based Kinetic (PBK) models in chemical risk assessment, as knowledge of internal exposure to chemicals is critical to understanding potential effects in vivo. In particular, a new generation of PBK models is being developed in which the model parameters are derived from in silico and in vitro methods. To increase the acceptance and use of these "Next Generation PBK models", there is a need to demonstrate their validity. However, this is challenging in the case of data-poor chemicals that are lacking in kinetic data and for which predictive capacity cannot, therefore, be assessed. The aim of this work is to lay down the fundamental steps in using a read across framework to inform modellers and risk assessors on how to develop, or evaluate, PBK models for chemicals without in vivo kinetic data. The application of a PBK model that takes into account the absorption, distribution, metabolism and excretion characteristics of the chemical reduces the uncertainties in the biokinetics and biotransformation of the chemical of interest. A strategic flow-charting application, proposed herein, allows users to identify the minimum information to perform a read-across from a data-rich chemical to its data-poor analogue(s). The workflow analysis is illustrated by means of a real case study using the alkenylbenzene class of chemicals, showing the reliability and potential of this approach. It was demonstrated that a consistent quantitative relationship between model simulations could be achieved using models for estragole and safrole (source chemicals) when applied to methyleugenol (target chemical). When the PBK model code for the source chemicals was adapted to utilise input values relevant to the target chemical, simulation was consistent between the models. The resulting PBK model for methyleugenol was further evaluated by comparing the results to an existing, published model for methyleugenol, providing further evidence that the approach was successful. This can be considered as a "read-across" approach, enabling a valid PBK model to be derived to aid the assessment of a data poor chemical.

Keywords: Analogues; Kinetics; PBK model; Read-across; Risk assessment.


Conflict of interest statement

The authors declare that they have no known competing financial interests or personal relationships that could have appeared to influence the work reported in this paper.

Figures

Fig. 1
Fig. 1
Workflow for identifying and using analogues for PBK model development and evaluation, as reported in the OECD PBK model guidance document .
Fig. 2
Fig. 2
Schematic representation of the strategic decision tree to assist selection of analogues in the context of developing a PBK model for a chemical that has no in vivo data for validation.
Fig. 3
Fig. 3
Proposed metabolic pathways of the alkenylbenzenes: estragole (right [14]), safrole (middle [16]) and methyleugenol (left [19]).
Fig. 4
Fig. 4
PBK model predictions of the amount of the chemical reaching the liver and venous blood (at 24hrs using a dose of 0.07 mg/kg BW) for estragole (4A-C) and safrole (4D-F) and when the parameters are changed to those for the target chemical – methyleugenol. Fig. 4G PBK model predictions of the amount of methyleugenol reaching the liver (at 24hrs using a dose of 0.07 mg/kg BW) using the original PBK model described in Al-Subeihi et al. .
Fig. 4H
Fig. 4H
Simulation of the amount of methyleugenol in blood, predicted using the source PBK models (safrole and estragole) adapted to use input data relevant to methyleugenol versus the original PBK model for methyleugenol and the in vivo data from Schecter et al. . The dose was adapted to a dietary intake of 0.00075 mg/Kg bw.
Fig. 5
Fig. 5
External dose response of chemical versus the formation of the hydroxyl (AMLHME), sulfo (AMLSHE) and glucuronide (AMLGME) metabolites in liver. AMLH = amount in liver of the metabolite; ME = methyleugenol. Each line represents simulation of the increasing external dose of the parent compound (0 – 300 mg/kg BW) versus the concentration of the internally formed metabolite, hydroxyl, glucuronidation, sulfation. Fig. 5A is the predictions based on the original PBK model for estragole; Fig. 5B was achieved using the estragole model but changing the MW and partition coefficient values to those of methyleugenol and its metabolite; Fig. 5C, changing also the in vitro kinetic constant in the model to the one of methyleugenol metabolite, but still based on the proposed biotransformation pathways of estragole.
Fig. 6
Fig. 6
Taking Fig. 5A and C which now represents Fig. 6A and 6B respectively. Comparison of the external dose-response formation of three metabolites formed, (1) hydroxylation (AMLHME), (2) sulfation (AMLSME), (3) glucuronidation (AMLGME), using the estragole model in a read across manner versus the original methyleugenol (ME). Part A = estragole model but changing the MW and PC values of methyleugenol and its metabolites; Part B changing also the kinetic constant of methyleugenol metabolite based on the proposed biotransformation pathways of estragole.
Fig. 7
Fig. 7
External dose response of chemical versus the formation of the hydroxyl (AMLHME), sulfo (AMLSHE) and glucuronide (AMLGME) metabolites in liver. AMLH = amount in liver of the metabolite; ME = methyleugenol. SA = Safrole. Each line represents simulation of the increasing external dose of the parent compound (0 – 300 mg/kg BW) versus the concentration of the internally formed metabolite, hydroxyl, glucuronidation, sulfation. Fig. 7A was achieved using the safrole model but changing the MW and partition coefficient values to those of methyleugenol and its metabolite; Fig. 7B, changing also the in vitro kinetic constant in the model to the one of methyleugenol metabolite, but still based on the proposed biotransformation pathways of safrole.
Fig. 8
Fig. 8
Taking Fig. 7A and B which now represents Fig. 8A and B respectively. Comparison of the external dose-response formation of three metabolites formed, (1) hydroxylation (AMLHME), (2) sulfation (AMLSME), (3) glucuronidation (AMLGME), using the safrole model in a read across manner versus the original methyleugenol (ME). Part A = safrole model but changing the MW and PC values of methyleugenol and its metabolites; Part B changing also the kinetic constant of methyleugenol metabolite based on the proposed biotransformation pathways of safrole.

References

    1. Bessems J.G.M., Paini A., Gajewska M., Worth A. The margin of internal exposure (MOIE) concept for dermal risk assessment based on oral toxicity data – a case study with caffeine. Toxicology. 2017;392:119–129. - PMC - PubMed
    1. Paini A., Leonard J.A., Kliment T., Tan Y.-M., Worth A. Investigating the state of physiologically based kinetic modelling practices and challenges associated with gaining regulatory acceptance of model applications. Regul. Toxicol. Pharmacol. 2017;90:104–115. - PMC - PubMed
    1. Paini A., Leonard J.A, Joossens E., Bessems J.G.M., Desalegn A., Dorne J.L., Gosling J.P., Heringa M.B., Klaric M., Kliment T., Kramer N.I., Loizou G., Louisse J., Lumen A., Madden J.C., Patterson E.A., Proença S., Punt A., Setzer R.W., Suciu N., Troutman J., Yoon M., Worth A., Tan Y.-M. Next generation physiologically based kinetic (NG-PBK) models in support of regulatory decision making. Comp. Tox. 2019;9:61–72. - PMC - PubMed
    1. OECD 2021, OECD Guidance Document on the Characterisation, Validation and Reporting of PBK Models for Regulatory Purposes. GD ENV/CBC/MONO(2021)1. Series on Testing and Assessment No. 331. Paris, France. Available at: https://www.oecd.org/officialdocuments/publicdisplaydocumentpdf/?cote=EN....
    1. ECHA 2017, Read-Across Assessment Framework (RAAF). Helsinki, Finland. DOI: 10.2823/619212. - DOI

LinkOut - more resources