. 2021 May;2(3):250-265.
doi: 10.1158/2643-3230.BCD-20-0105. Epub 2021 Mar 10.

Avadomide induces degradation of ZMYM2 fusion oncoproteins in hematologic malignancies

Affiliations

Avadomide induces degradation of ZMYM2 fusion oncoproteins in hematologic malignancies

Aline Renneville et al. Blood Cancer Discov. 2021 May.

Abstract

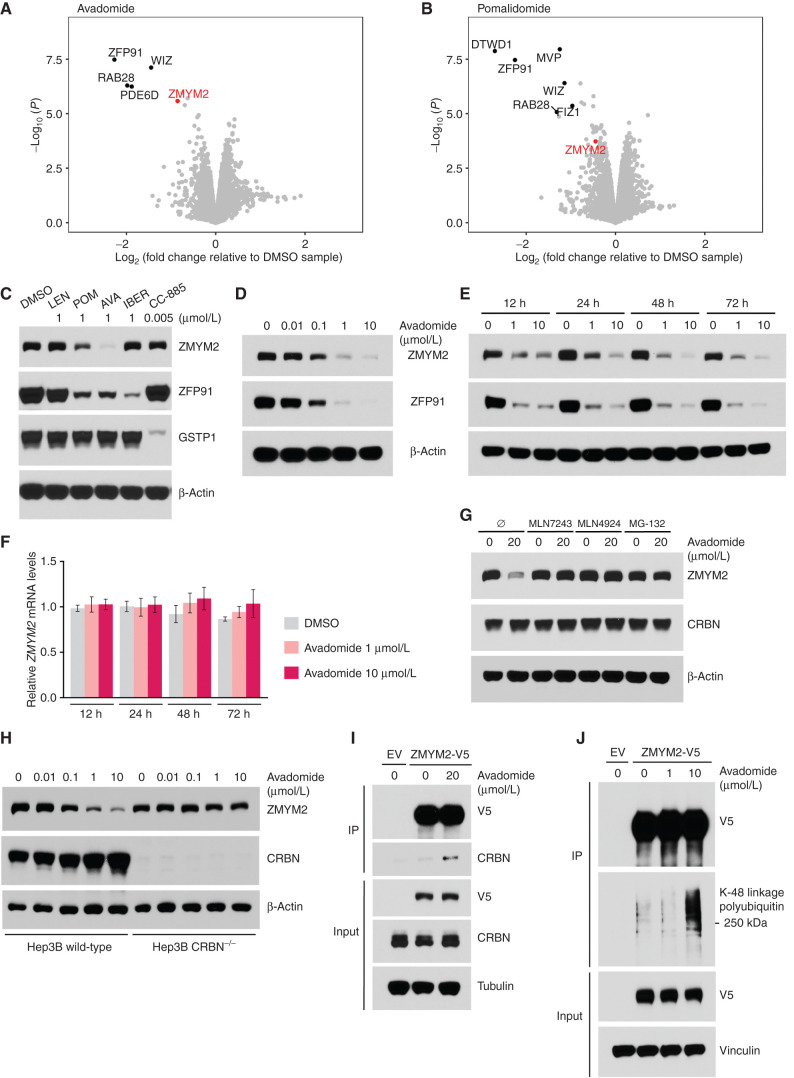
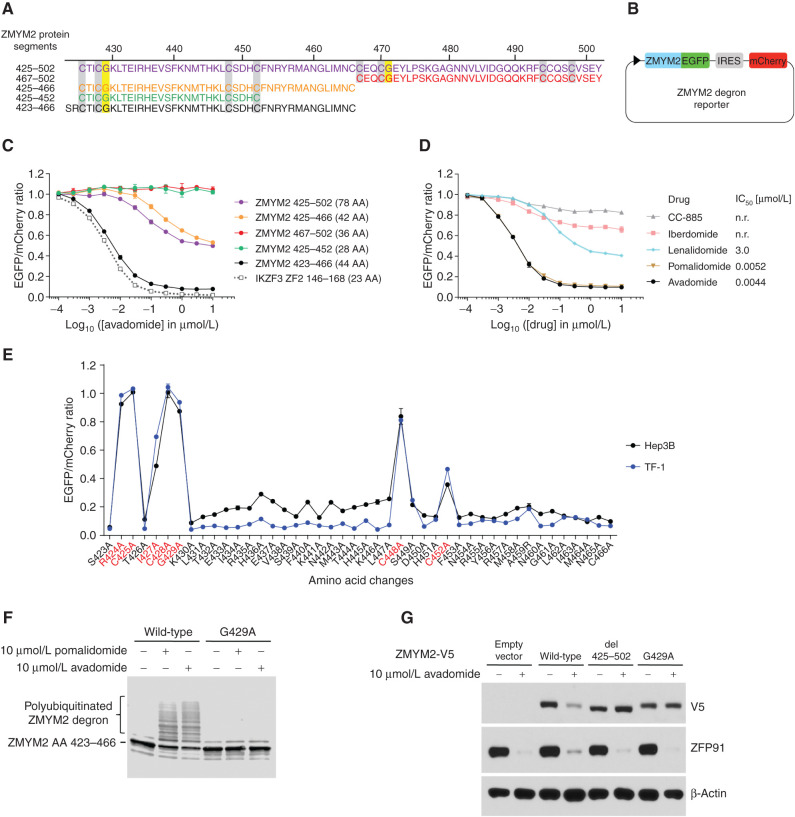
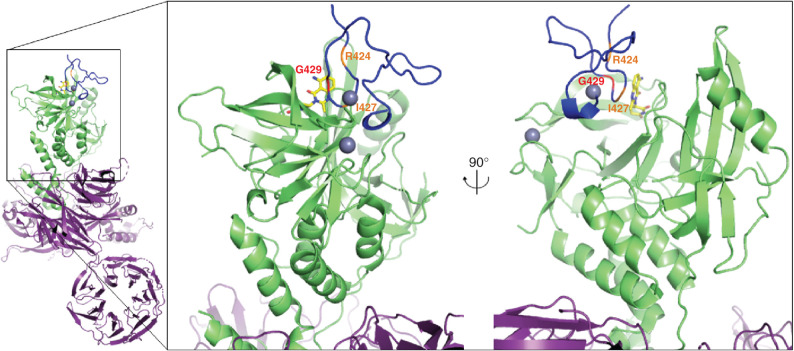
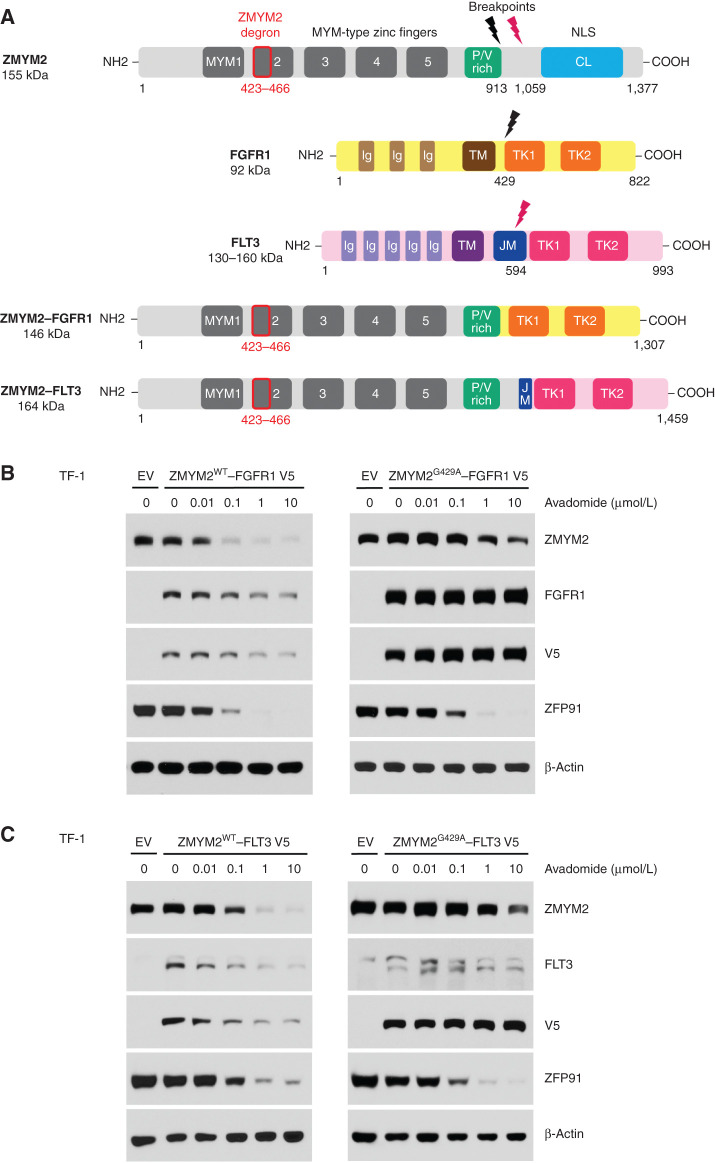
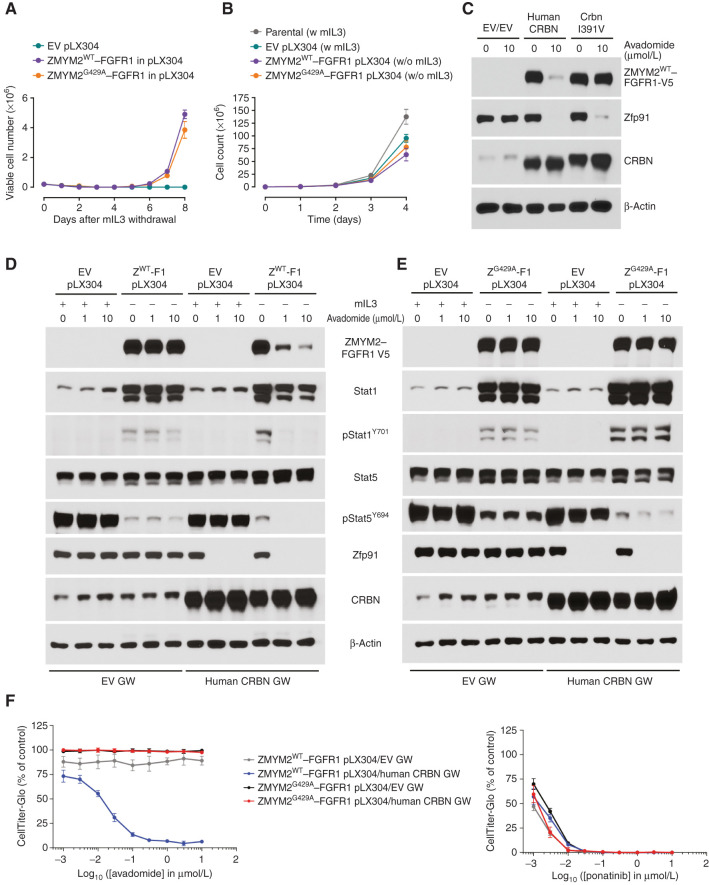
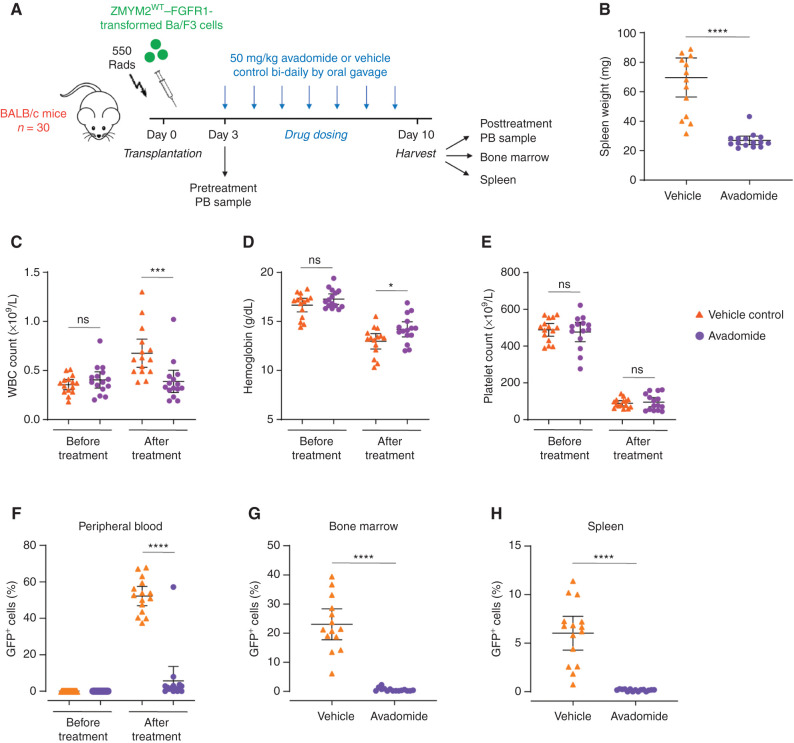
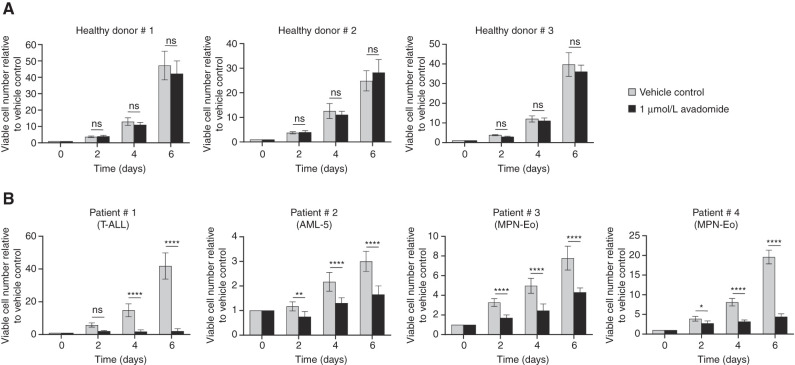
Thalidomide analogs exert their therapeutic effects by binding to the CRL4CRBN E3 ubiquitin ligase, promoting ubiquitination and subsequent proteasomal degradation of specific protein substrates. Drug-induced degradation of IKZF1 and IKZF3 in B-cell malignancies demonstrates the clinical utility of targeting disease-relevant transcription factors for degradation. Here, we found that avadomide (CC-122) induces CRBN-dependent ubiquitination and proteasomal degradation of ZMYM2 (ZNF198), a transcription factor involved in balanced chromosomal rearrangements with FGFR1 and FLT3 in aggressive forms of hematologic malignancies. The minimal drug-responsive element of ZMYM2 is a zinc-chelating MYM domain and is contained in the N-terminal portion of ZMYM2 that is universally included in the derived fusion proteins. We demonstrate that avadomide has the ability to induce proteasomal degradation of ZMYM2-FGFR1 and ZMYM2-FLT3 chimeric oncoproteins, both in vitro and in vivo. Our findings suggest that patients with hematologic malignancies harboring these ZMYM2 fusion proteins may benefit from avadomide treatment.

Keywords: fusion oncoproteins; hematologic malignancies; thalidomide analogs; ubiquitination; zinc finger protein.


Conflict of interest statement

Disclosure of potential conflicts of interest B.L. Ebert has received research funding from Celgene and Deerfield. He has received consulting fees from GRAIL, and he serves on the scientific advisory boards for Skyhawk Therapeutics, Exo Therapeutics, and Neomorph Therapeutics. S.A. Carr is a member of the scientific advisory boards of Kymera, PTM BioLabs and Seer and a scientific advisor to Pfizer and Biogen.

Figures

Figure 1.
Figure 1.
Avadomide promotes ZMYM2 degradation in a CRBN- and proteasome-dependent manner. A and B, Volcano plot illustrating changes in protein abundance assessed by proteomic analysis in Hep3B cells after 12 hours of treatment with 10 μmol/L avadomide (A) or 24 hours of treatment with 1 μmol/L pomalidomide (B). The plots represent statistical significance versus the fold change in protein abundance relative to the DMSO vehicle control. Results from two biological replicates are shown. Average log2 fold change in ZMYM2 protein abundance: –0.858, Padj value: 0.002 (A); –0.45, Padj value: 0.043 (B). C, Immunoblot analysis of ZMYM2, ZFP91, and GSPT1 protein levels after 24-hour treatment with DMSO, 1 μmol/L lenalidomide (LEN), 1 μmol/L pomalidomide (POM), 1 μmol/L avadomide (AVA), 1 μmol/L iberdomide (IBER), or 0.005 μmol/L CC-885 in Hep3B cells. ZFP91 and GSPT1 are shown as positive controls for degradation. D, Immunoblot analysis of ZMYM2 protein level in Hep3B cells treated with the indicated concentrations of avadomide for 24 hours. E, Time course of avadomide treatment in Hep3B cells for ZMYM2 protein level. F, Time course of avadomide treatment in Hep3B cells for ZMYM2 mRNA levels assessed by real-time qPCR. Data are mean ± SD, n = 3 technical replicates. G, Immunoblot analysis of ZMYM2 protein levels in Hep3B cells treated for 12 hours with DMSO or 20 μmol/L avadomide alone or in the presence of 0.5 μmol/L MLN7243, 5 μmol/L MLN4924, or 2 μmol/L MG-132. H, Immunoblot analysis of ZMYM2 protein level in wild-type or CRBN knockout Hep3B cells treated with avadomide for 24 hours. I, Immunoprecipitation of ZMYM2-V5 in Hep3B cells treated for 3 hours with DMSO or 10 μmol/L avadomide in the presence of 10 μmol/L MG-132.J, Ubiquitination analysis of ZMYM2-V5 in Hep3B cells treated with DMSO or the indicated concentrations of avadomide for 6 hours in the presence of 10 μmol/L MG-132. EV, empty vector; IP, immunoprecipitated. Results in CJ are representative of three independent experiments.
Figure 2.
Figure 2.
Identification of the ZMYM2 degron and amino acids critical for drug-induced degradation. A, Sequence alignment of ZMYM2 MYM2 domain and the different peptides tested for degradation using the reporter assay. The cysteine residues that coordinate the zinc ions are highlighted in gray. The glycine residues following a CXXC motif are highlighted in yellow. B, Schematic of the protein degradation reporter vector used to identify the ZMYM2 degron. IRES, internal ribosome entry site. C, Hep3B cells stably expressing the ZMYM2 constructs in the degradation reporter were treated for 20 hours with DMSO or avadomide and analyzed by flow cytometry to quantify the DMSO-normalized ratio of EGFP/mCherry fluorescence. The dose–response curve for IKZF1/3 zinc finger 2 (ZF2) domain is represented as a reference (mean ± SD, n = 4 biological replicates). AA, amino acid. D, Effect of different thalidomide analogues on the degradation of the ZMYM2 423–466 wild-type degron in the reporter vector in Hep3B cells (mean ± SD, n = 4 biological replicates). IC50, inhibitory concentration 50; n.r., not reached. E, Alanine scan of the ZMYM2 423–466 degron using the reporter assay in Hep3B and TF-1 cells treated with 1 μmol/L avadomide for 20 hours. Amino acids that reduced degradation above 0.4 when mutated into an alanine are in red font (mean ± SD, n = 3 biological replicates). F, MBP-tagged ZMYM2 amino acids 423–466 wild-type or G429A were tested for in vitro ubiquitination by CRBN–CRL4 in the absence or presence of 10 μmol/L pomalidomide or avadomide. Ubiquitination reactions were separated by SDS-PAGE, followed by anti-MBP. G, Immunoblot validation of the ZMYM2 degron in Hep3B cells transfected with the empty vector, ZMYM2 wild-type, ZMYM2 with deletion of the MYM2 domain (del 425–502), or ZMYM2-binding mutant G429A and treated with DMSO or 10 μmol/L avadomide for 24 hours. Results in CG are representative of three independent experiments.
Figure 3.
Figure 3.
Structural model of ZMYM2 recruitment to DDB1–CRBN bound to avadomide. A model of ZMYM2 amino acids 421–453 (blue), with the positions of G429 highlighted in red and R424 and I427 in orange, shown bound to the complex of DDB1 (purple), CRBN (green), and avadomide (yellow). Zinc ions are shown as gray spheres. The glycine-containing β-hairpin degron of ZMYM2 was docked on the basis of the structures of other glycine-containing degron substrates recruited to CRBN (8, 27, 28).
Figure 4.
Figure 4.
Avadomide promotes ZMYM2–FGFR1 and ZMYM2–FLT3 fusion protein degradation. A, Schematic representation of ZMYM2, FGFR1, FLT3, and the chimeric fusion proteins ZMYM2–FGFR1 and ZMYM2–FLT3. The indicated breakpoints reported in previous studies (15, 22) have been used to clone both fusion sequences in expression vectors for immunoblot validation. In the context of the ZMYM2–FGFR1 fusion, the ZMYM2 proline/valine (P-V)-rich domain has been shown to mediate oligomerization and tyrosine kinase constitutive activation (31). CL, Cre-like domain; Ig, immunoglobulin-like domain; JM, juxtamembrane domain; NLS, nuclear localization site; TK, tyrosine kinase domain; TM, transmembrane domain. B and C, Immunoblot validation of the chimeric fusion protein degradation in TF-1 cells stably expressing the V5-tagged ZMYM2–FGFR1 (B) or ZMYM2–FLT3 (C) fusion protein, either with the WT or the G429A mutant degron, and treated with avadomide for 24 hours. Results are representative of three independent experiments. EV, empty vector; WT, wild-type.
Figure 5.
Figure 5.
Avadomide affects viability of ZMYM2–FGFR1-transformed Ba/F3 cells expressing human CRBN. A, Growth curves assessed by Trypan blue staining after mIL3 withdrawal in Ba/F3 cells transduced with lentiviruses expressing the EV, ZMYM2WT–FGFR1, or ZMYM2G429A–FGFR1 (mean ± SD, n = 3–4 biological replicates). B, Growth curves assessed by Trypan blue staining in ZMYM2–FGFR1-transformed Ba/F3 cells in the absence of mIL3, in comparison with Ba/F3 parental and the EV control in the presence of mIL3 (mean ± SD, n = 3–4 biological replicates). C, Immunoblot analysis in Ba/F3 cells transformed by V5-tagged ZMYM2WT–FGFR1 in pLX304 and subsequently transduced with lentiviruses expressing either human CRBN or the humanized mouse CrbnI391V mutant in GW vector. Ba/F3 cells transduced with both EV pLX304 and EV GW are shown as a negative control. Ba/F3 cells were treated with DMSO or 10 μmol/L avadomide for 24 hours. D and E, Immunoblot analysis in Ba/F3 cells transduced with EV pLX304 and EV GW or human CRBN in GW, and Ba/F3 cells transformed by V5-tagged ZMYM2WT–FGFR1 (D) or ZMYM2G429A–FGFR1 (E) in pLX304 and subsequently transduced with EV GW or human CRBN in GW. Ba/F3 cells were treated with DMSO or 1 μmol/L or 10 μmol/L avadomide for 24 hours. F, Cell viability assessed by CellTiter-Glo in Ba/F3 cells transformed by ZMYM2WT–FGFR1 or ZMYM2G429A–FGFR1 and transduced with EV GW or human CRBN in GW. Ba/F3 cells were treated with different concentrations of avadomide or ponatinib for 48 hours (mean ± SD, n = 6 biological replicates). Results in AF are representative of three independent experiments. EV, empty vector; GW, Gateway; mIL3, murine IL3; WT, wild-type; Z-F1, ZMYM2–FGFR1.
Figure 6.
Figure 6.
Effects of avadomide treatment on ZMYM2–FGFR1-transformed Ba/F3 cells in vivo. A, Experimental design of the mouse experiment. ZMYM2WT–FGFR1-transformed Ba/F3 cells expressing human CRBN were retro-orbitally injected into sublethally irradiated BALB/c mice. n = 15 mice for both treatment groups. PB, peripheral blood. B, Spleen weight at day 10 posttransplantation. White blood cell count (WBC; C), hemoglobin level (D), and platelet count (E) measured in peripheral blood samples collected before and after treatment. F–H, Percentage of GFP-positive cells assessed by flow cytometry in peripheral blood (F), bone marrow (G), and spleen (H). P values are from an unpaired two-sided t test. ns, nonstatistically significant. ****, P < 0.0001; ***, P < 0.001; *, P < 0.05.
Figure 7.
Figure 7.
Effects of avadomide treatment on primary human CD34+ hematopoietic stem and progenitor cells ex vivo. Viable cell counts assessed by Trypan blue staining in bone marrow CD34+ cells collected from healthy donors (A) and patients with ZMYM2–FGFR1-positive hematologic malignancy (B) are represented after 2, 4, or 6 days of treatment by 1 μmol/L avadomide or the vehicle control (mean ± SD, n = 4–6 biological replicates). P values are from an unpaired two-sided t test. ns, nonstatistically significant. ****, P < 0.0001; **, P < 0.01; *, P < 0.05. AML-5, acute myeloid leukemia 5 (monoblastic); MPN-Eo, myeloproliferative neoplasm with eosinophilia; T-ALL, T-cell acute lymphoblastic leukemia.

Similar articles

Cited by

References

    1. Ito T, Ando H, Suzuki T, Ogura T, Hotta K, Imamura Y, et al. Identification of a primary target of thalidomide teratogenicity. Science 2010;327:1345–50. - PubMed
    1. Kronke J, Udeshi ND, Narla A, Grauman P, Hurst SN, McConkey M, et al. Lenalidomide causes selective degradation of IKZF1 and IKZF3 in multiple myeloma cells. Science 2014;343:301–5. - PMC - PubMed
    1. Kronke J, Fink EC, Hollenbach PW, MacBeth KJ, Hurst SN, Udeshi ND, et al. Lenalidomide induces ubiquitination and degradation of CK1alpha in del(5q) MDS. Nature 2015;523:183–8. - PMC - PubMed
    1. Lu G, Middleton RE, Sun H, Naniong M, Ott CJ, Mitsiades CS, et al. The myeloma drug lenalidomide promotes the cereblon-dependent destruction of Ikaros proteins. Science 2014;343:305–9. - PMC - PubMed
    1. Chamberlain PP, Cathers BE. Cereblon modulators: low molecular weight inducers of protein degradation. Drug Discov Today Technol 2019;31:29–34. - PubMed

Publication types