. 2021 May 5;2(2):100527.
doi: 10.1016/j.xpro.2021.100527. eCollection 2021 Jun 18.

A diacylglycerol photoswitching protocol for studying TRPC channel functions in mammalian cells and tissue slices

Affiliations

A diacylglycerol photoswitching protocol for studying TRPC channel functions in mammalian cells and tissue slices

Trese Leinders-Zufall et al. STAR Protoc. .

Abstract

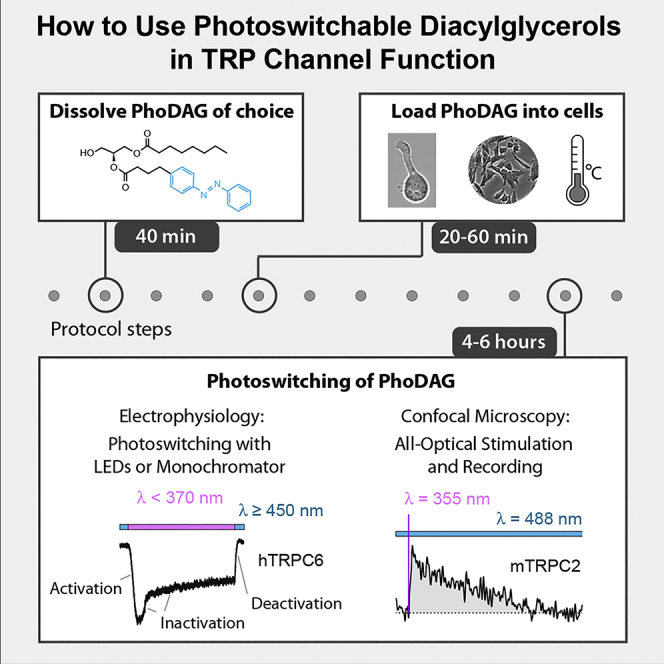
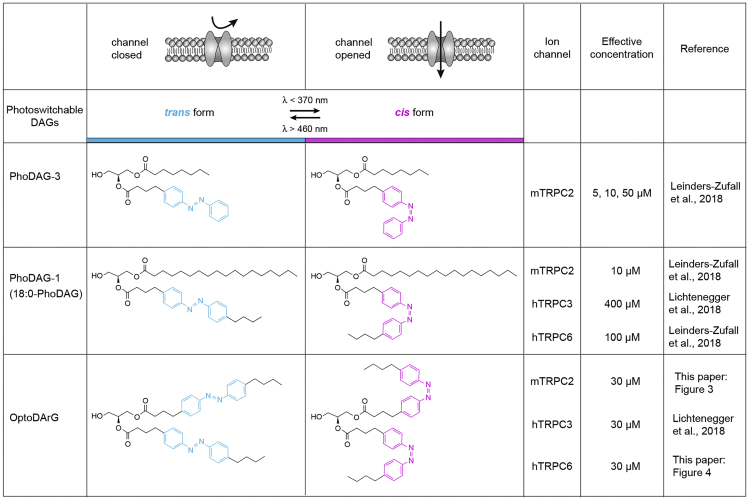
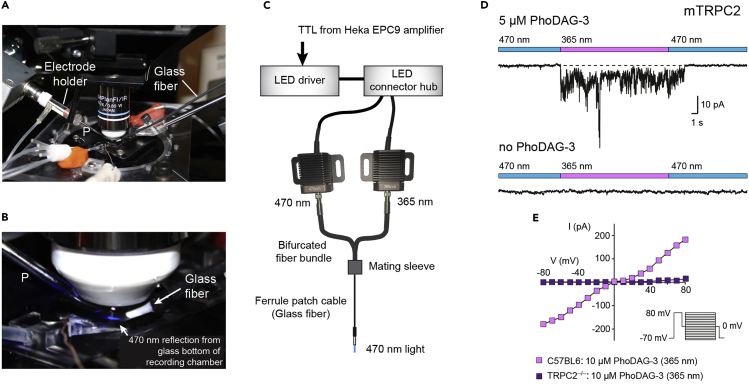
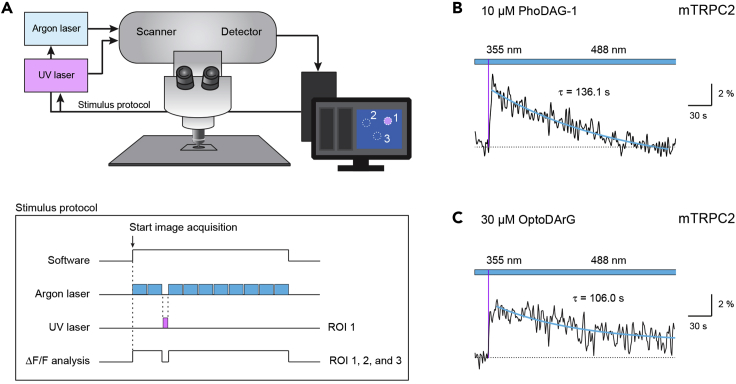
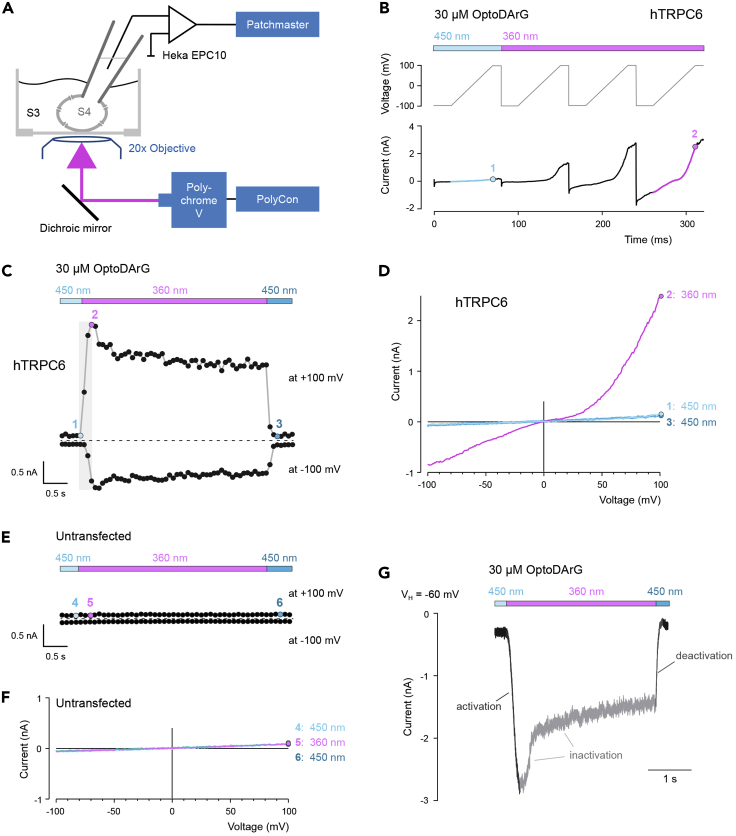
Small molecular probes designed for photopharmacology and opto-chemogenetics are rapidly gaining widespread recognition for investigations of transient receptor potential canonical (TRPC) channels. This protocol describes the use of three photoswitchable diacylglycerol analogs-PhoDAG-1, PhoDAG-3, and OptoDArG-for ultrarapid activation and deactivation of native TRPC2 channels in mouse vomeronasal sensory neurons and olfactory type B cells, as well as heterologously expressed human TRPC6 channels. Photoconversion can be achieved in mammalian tissue slices and enables all-optical stimulation and shutoff of TRPC channels. For complete details on the use and execution of this protocol, please refer to Leinders-Zufall et al. (2018).

Keywords: Cell Biology; Microscopy; Molecular/Chemical Probes; Neuroscience.


Conflict of interest statement

The authors declare no competing interests.

Figures

None
Graphical abstract
Figure 1
Figure 1
Chemical structures of three distinct photoswitchable diacylglycerols: PhoDAG-3 and PhoDAG-1 (new commercial name, 18:0-PhoDAG) (Frank et al., 2016; Leinders-Zufall et al., 2018), and OptoDArG (Lichtenegger et al., 2018) These DAG analogs isomerize between their trans- and cis configurations in response to UV-A (λ < 370 nm) and blue (λ > 460 nm) illumination, respectively. The cis forms of these DAG analogs have been shown to activate mouse TRPC2, human TRPC3, and human TRPC6 (Leinders-Zufall et al., 2018; Lichtenegger et al., 2018). Compare also Figures 3 and 4 shown below.
Figure 2
Figure 2
DAG photoswitching using fiber-coupled LEDs (A) Image showing the stage of an upright fixed-stage microscope to indicate the recording chamber located underneath a 40x objective, the location of the electrode holder with its glass recording electrode pipette (P), and the holder with the glass fiber for photomanipulation. (B) Enlargement of the recording chamber showing the 40x objective, the recording pipette (P), and the ferrule glass fiber cable. Light (λ = 470 nm) from the fiber-coupled LED can be seen due to its reflection from the glass bottom of the recording chamber that contains dissociated VSNs. (C) Schematic of the LED configuration used for DAG photoswitching. A TTL signal from the amplifier (Heka EPC9) triggers the LED driver which, in turn, activates the LED connector hub. The connector hub drives either of two fiber-coupled LEDs (λ = 470 nm or 365 nm). The LED light is sent through a bifurcated fiber bundle to an optic mating sleeve which aligns the 400-μm thick bifurcated fiber with a thinner optical fiber. This fiber is placed in the bath solution close to the cells. (D) UV exposure (365 nm) of a freshly dissociated VSN preincubated with PhoDAG-3 at 5 μM causes rapid activation of sustained channel activity that terminates upon exposure to 470 nm light. Whole-cell voltage-clamp recording; holding potential, −70 mV. No such currents could be induced in VSNs not preincubated with PhoDAG-3 (lower trace). (E) Steady-state current-voltage relationships of photoactivated currents after digital subtraction of the currents obtained before PhoDAG-3 treatment (no PhoDAG-3, dark) from an individual VSN isolated from either a C57BL6 mouse or a TRPC2 knockout (–/–) mouse. D and E are adopted with permission from Figure 1B, 1H, and 1J in Leinders-Zufall et al., 2018. See also Leinders-Zufall et al. (2018) for detailed information regarding voltage step and clamp protocols.
Figure 3
Figure 3
Combined DAG photoswitching and intracellular calcium recording using an all-optical confocal laser scanning approach (A) Sketch and stimulus protocol for an upright Zeiss LSM880 laser scanning confocal microscope that contains modifications to enable the combined use of a UV laser (355 nm) for photomanipulation and an Argon laser (488 nm) for excitation of the calcium indicator dye. The Argon laser exciting the calcium fluorophore will scan the preset image size of 512 x 512 pixels at a set cycle time with only a short gap between the scans. The photomanipulation with the UV laser switching the PhoDAG to the active cis-form will interrupt the collection of images from the calcium fluorophore. This pause will depend on the duration of the scanning time in one or multiple regions of interest. In the example shown, one ROI (cell # 1) is excited by the UV laser. Due to the gap in collecting the fluorophore signals of all ROIs, the ΔF/F analysis will thus display a pause in the recording. (B) Example of the Ca2+ response of a TRPC2-expressing olfactory type B cell loaded with PhoDAG-1 (10 μM). Photoswitching to 355 nm (10 mW) for 61 ms (thin magenta line) evoked a transient elevation in intracellular Ca2+. The photostimulus consisted of 40 individual scans with a pixel dwell time of 2.05 μs, resulting in a total UV exposure time of 61 ms. Decay time constant of the Ca2+ transient is indicated. Figure reprinted with permission from Figure 4D in Leinders-Zufall et al., 2018. (C) Example of the Ca2+ response of an olfactory TRPC2-expressing cell loaded with OptoDArG (30 μM). Photoswitching to 355 nm (30 mW) for 54 ms (thin magenta line) evoked a transient elevation in intracellular Ca2+. The photostimulus consisted of 100 individual scans with a pixel dwell time of 2.05 μs, resulting in a total UV exposure time of 54 ms.
Figure 4
Figure 4
Photoswitching of OptoDArG activates human TRPC6 channels expressed in HEK293T cells (A) Schematic depiction of the setup for whole-cell measurements of HEK293T cells using an inverse microscope. Photoswitching was performed with light produced by the monochromator Polychrome V that was controlled by the PolyCon software. The stage of the microscope contained the recording chamber. The Heka EPC10 amplifier with Patchmaster software and the recording electrode are displayed. The microscope was equipped with a 20 x oil immersion objective and with a filter cube containing a dichroic mirror. Pipette solution (S4); bath solution (S3). (B) Voltage protocols and resulting currents of HEK293T cells expressing hTRPC6 and preincubated with 30 μM OptoDArG. Currents were measured over time and after stimulation with λ = 450 nm (blue) or λ = 360 nm light (pink). The gray line illustrates the ramp voltage protocols. Ramp currents were examined using 50 ms voltage ramps from −100 to 100 mV (4 V/s). The ramp current with 450 nm exposure is indicated in blue and with a blue data point at 100 mV (1). The ramp current with 360 nm exposure is indicated in pink and with a pink data point at 100 mV (2). (C) Single data points obtained from ramp currents of the experiment shown in B are plotted at 100 and −100 mV vs. time. Exposure to 360 nm UV light caused the switching of OptoDArG from the trans to the cis form and the activation of hTRPC6 channels. The data points within the gray box are from the current ramps shown in B, whereby the colored data points depict the value at 100 mV. Switching back to 450 nm light exposure returned the ramp currents at 100 and −100 mV back to their original value. The colored data points (1–3) are plotted as I-V curves in D. (D) I-V curves obtained from the ramp protocols shown in B. The numbers (1, 2, and 3) indicate the time points at which the I-V curves are extracted from C. (E and F) Data points obtained from ramp currents of an untransfected HEK297T cell preincubated with 30 μM OptoDArG are plotted at 100 and −100 mV vs. time using the same ramp and analysis protocols as in B and C. The colored data points (4–6) are plotted as I-V curves in F. Exposure to 360 nm UV light failed to induce a current under these conditions. (G) Representative time course of a light-evoked hTRPC6 current recorded at a holding potential (VH) of −60 mV. The activation phase, inactivation with fast and slow phases, and deactivation phase of the hTRPC6 current are indicated. (B, C, E and G) Illumination protocol using light of the wavelengths λ = 360 nm or λ = 450 nm is depicted above each trace.

References

    1. Bleymehl K., Pérez-Gómez A., Omura M., Moreno-Pérez A., Macías D., Bai Z., Johnson R.S., Leinders-Zufall T., Zufall F., Mombaerts P. A sensor for low environmental oxygen in the mouse main olfactory epithelium. Neuron. 2016;92:1196–1203. - PMC - PubMed
    1. Blum T., Moreno-Pérez A., Pyrski M., Bufe B., Arifovic A., Weissgerber P., Freichel M., Zufall F., Leinders-Zufall T. Trpc5 deficiency causes hypoprolactinemia and altered function of oscillatory dopamine neurons in the arcuate nucleus. Proc. Natl. Acad. Sci. U S A. 2019;116:15236–15243. - PMC - PubMed
    1. Brechbühl J., Gaëlle L., Moine F., Rodriguez I., Broillet M.-C. Imaging pheromone sensing in a mouse vomeronasal acute tissue slice preparation. J. Vis. Exp. 2011;58:e3311. - PMC - PubMed
    1. Chamero P., Weiss J., Alonso M.T., Rodríguez-Prados M., Hisatsune C., Mikoshiba K., Leinders-Zufall T., Zufall F. Type 3 inositol 1,4,5-trisphosphate receptor is dispensable for sensory activation of the mammalian vomeronasal organ. Sci. Rep. 2017;7:10260. - PMC - PubMed
    1. Chen X., Sooch G., Demaree I.S., White F.A., Obukhov A.G. Transient receptor potential canonical (TRPC) channels: then and now. Cells. 2020;9:1983. - PMC - PubMed

Publication types

MeSH terms

LinkOut - more resources