. 2021 May 24;6(10):e147134.
doi: 10.1172/jci.insight.147134.

Integrin α9 regulates smooth muscle cell phenotype switching and vascular remodeling

Affiliations

Integrin α9 regulates smooth muscle cell phenotype switching and vascular remodeling

Manish Jain et al. JCI Insight. .

Abstract

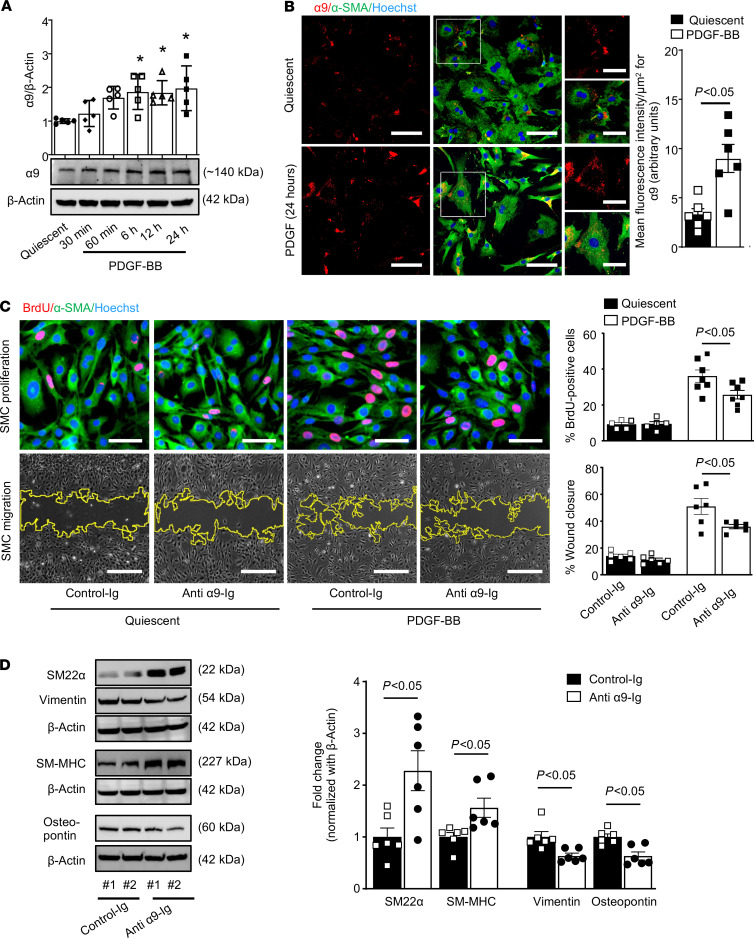
Excessive proliferation of vascular smooth muscle cells (SMCs) remains a significant cause of in-stent restenosis. Integrins, which are heterodimeric transmembrane receptors, play a crucial role in SMC biology by binding to the extracellular matrix protein with the actin cytoskeleton within the SMC. Integrin α9 plays an important role in cell motility and autoimmune diseases; however, its role in SMC biology and remodeling remains unclear. Herein, we demonstrate that stimulated human coronary SMCs upregulate α9 expression. Targeting α9 in stimulated human coronary SMCs, using anti-integrin α9 antibody, suppresses synthetic phenotype and inhibits SMC proliferation and migration. To provide definitive evidence, we generated an SMC-specific α9-deficient mouse strain. Genetic ablation of α9 in SMCs suppressed synthetic phenotype and reduced proliferation and migration in vitro. Mechanistically, suppressed synthetic phenotype and reduced proliferation were associated with decreased focal adhesion kinase/steroid receptor coactivator signaling and downstream targets, including phosphorylated ERK, p38 MAPK, glycogen synthase kinase 3β, and nuclear β-catenin, with reduced transcriptional activation of β-catenin target genes. Following vascular injury, SMC-specific α9-deficient mice or wild-type mice treated with murine anti-integrin α9 antibody exhibited reduced injury-induced neointimal hyperplasia at day 28 by limiting SMC migration and proliferation. Our findings suggest that integrin α9 regulates SMC biology, suggesting its potential therapeutic application in vascular remodeling.

Keywords: Cell migration/adhesion; Integrins; Mouse models; Vascular Biology.


Conflict of interest statement

Conflict of interest: The authors have declared that no conflict of interest exists.

Figures

Figure 1
Figure 1. Integrin α9 is upregulated in stimulated human coronary SMCs, and treatment with anti–integrin α9 antibody suppresses synthetic phenotype and inhibits proliferation and migration.
(A) Serum-starved human coronary SMCs were stimulated with or without PDGF-BB for indicated time points. Representative immunoblots and densitometric analysis of α9 and expression levels. β-Actin was used as a loading control (n = 5/group). (B) The left panels show representative double immunostaining for α9 (shown in red) and SMC actin (αSMA) (shown in green) in SMCs stimulated with or without PDGF-BB for 24 hours. Boxed regions are magnified (scale bars: 25 μm). Scale bars: 50 μm. The right panel shows the quantification of α9 fluorescence intensity (n = 6/group). (C and D) Quiescent human coronary SMCs were pretreated with anti-α9 blocking antibody (clone Y9A2, 10 μg/mL) for 60 minutes. (C) Human coronary SMCs were stimulated with PDGF-BB for 24 hours. The top panels show representative BrdU-positive cells (red) costained with αSMA (green) and Hoechst (blue). Scale bars: 50 μm. The bottom panels show representative phase-contrast images of SMC migration in the scratch assay. Scale bars: 500 μm. The right panel shows the quantification of BrdU-positive cells to the total number of cells (n = 6/group) and migrated area (n = 6/group). (D) Representative immunoblots and densitometric analysis of SM22α, SM-MHC, vimentin, and osteopontin (n = 6/ group) in human coronary SMCs stimulated with PDGF-BB for 24 hours. #1 and #2 represent 2 separate samples. Statistical analysis: (A) 1-way ANOVA with Bonferroni’s post hoc test; (C) 2-way ANOVA followed by uncorrected Fisher’s least significant differences (LSD) test (B and D) unpaired 2-tailed Student’s t test. *P < 0.05 vs. quiescent or vehicle-treated (control Ig) groups.
Figure 2
Figure 2. Anti–integrin α9 antibody suppresses FAK/Src, ERK, p38, and glycogen synthase kinase 3β/β-catenin pathway.
Serum-starved human coronary SMCs were stimulated with or without PDGF-BB. (A) Representative Western blots and densitometric analysis of FAK, Src, ERK1/2, p38, and β-actin after 30 minutes of PDGF-BB stimulation (n = 4/group). (B) Representative Western blots and densitometric analysis of GSK3β, β-catenin, and β-actin after 30 minutes of PDGF-BB stimulation. Nuclear extracts were prepared after 6 hours of PDGF-BB stimulation. β-Catenin and Lamin B1 were detected by immunoblotting (n = 4/group). Statistical analysis: 2-way ANOVA followed by uncorrected Fisher’s LSD test. *P < 0.05 vs. quiescent + control Ig; #P < 0.05 vs. PDGF-BB + control Ig–treated groups. p-ERK, phosphorylated ERK.
Figure 3
Figure 3. SMC-specific integrin α9 modulates neointimal hyperplasia in mice.
All mice are on Apoe–/– background. Serum-deprived SMCs were stimulated with or without PDGF-BB (20 ng/mL) for indicated time points. (A) Representative immunoblots and densitometric analysis of α9 expression levels. β-Actin was used as a loading control (n = 4). (B) Quantification of α9 mRNA expression by real-time PCR (n = 6). (C) Western blot analysis of α9 and β-actin in SMCs isolated from α9SMC-KO and control α9fl/fl mice. #1 and #2 represent samples from 2 individual mice. (D) The left panels show representative photomicrographs of Verhoeff’s van Gieson–stained carotid artery sections from male and female α9SMC-KO and control α9fl/fl mice after 28 days of injury (male n = 12–13; female n = 9/group). Scale bars: 200 μm. The right panels show quantification of intimal area, medial area, and a ratio of intimal to medial area. Each dot represents a single mouse. (E) The left panels show representative BrdU-positive cells (red) counterstained with αSMA (green). Nuclei are counterstained with Hoechst (blue). The right panel shows the quantification of percentage BrdU-positive cells (n = 7). Scale bars: 200 μm. (F) The left panels show representative TUNEL-positive cells (green) counterstained with Hoechst (blue). The right panel shows the quantification of TUNEL-positive cells (n = 7). Scale bars: 200 μm. Values are represented as mean ± SEM. Statistical analysis: (A) 1-way ANOVA followed by Bonferroni’s post hoc test; (BF) unpaired 2-tailed Student’s t test. *P < 0.05 versus quiescent. N.D., not detected.
Figure 4
Figure 4. SMC-specific α9 deletion suppresses PDGF-BB–induced SMC proliferation, migration, and phenotypic switching.
Aortic SMCs isolated from α9SMC-KO and control α9fl/fl mice were serum-starved and stimulated with PDGF-BB for 24 hours. (A) The left upper panels show representative BrdU-positive cells (red) costained with αSMA (green) and Hoechst (blue). Scale bars: 50 μm. The left lower panels show representative phase-contrast images of SMC migration in the scratch assay. Scale bars: 500 μm. The right panel shows the quantification of BrdU-positive cells to the total number of cells and quantification of the migrated area (n = 6). (B) Representative immunoblots and densitometric analysis of contractile proteins (SM22α and SM-MHC) and synthetic proteins (vimentin and osteopontin) (n = 8). (C) The left panels show representative immunostained images for contractile proteins (SM22α, green; and SM-MHC, green) and synthetic proteins (vimentin, red; and osteopontin, red). Scale bars: 50 μm. The right panels show quantification of the fluorescence intensity for SM22α, SM-MHC, vimentin, and osteopontin (n = 6 per group). Values are expressed as mean ± SEM. Statistical analysis: (A) 2-way ANOVA followed by uncorrected Fisher’s LSD test; (B and C) unpaired 2-tailed Student’s t test.
Figure 5
Figure 5. SMC-specific α9 deletion suppresses FAK, Src, ERK, p38, and GSK3β/β-catenin pathway.
Aortic SMCs isolated from α9SMC-KO and control α9fl/fl mice were serum-starved for 48 hours. (A) Representative Western blots and densitometric analysis of FAK, Src, ERK1/2, p38, and β-actin after 30 minutes of PDGF-BB stimulation (n = 4). (B) Representative Western blots and densitometric analysis of GSK3β, β-catenin, and β-actin after 30 minutes of PDGF-BB stimulation (n = 4). Nuclear extracts were prepared after 6 hours of PDGF-BB stimulation. β-Catenin and Lamin B1 were detected by immunoblotting (n = 4). (C) Real-time quantitative PCR analysis of cyclin D1, MMP-2, MMP-9, and c-Myc (n = 5) in SMCs stimulated with PDGF-BB (20 ng/mL) for 24 hours. Values are expressed as mean ± SEM. Statistical analysis: (A and B) 2-way ANOVA followed by uncorrected Fisher’s LSD test. *P < 0.05 versus α9fl/fl quiescent SMCs, #P < 0.05 vs α9fl/fl PDGF-BB–treated SMCs. (C) Unpaired 2-tailed Student’s t test.
Figure 6
Figure 6. Fn-EDA partially contributes to α9-mediated SMC proliferation and migration.
Quiescent SMCs were exposed to 10 μg/mL of recombinant peptides containing or lacking EDA. (A) The upper left panels show representative images of BrdU-positive cells (red) costained with αSMA (green) and Hoechst (blue) analyzed 24 hours after EDA peptide treatment. Scale bar: 50 μm. Lower left panels show representative phase-contrast images of SMC migration in the scratch assay analyzed 24 hours after EDA peptide treatment. Scale bar: 500 μm. The right panels show quantification of BrdU-positive cells (n = 5) and migrated area (n = 5). (B) Cells were processed for Western blotting after 24 hours of EDA peptide treatment. Representative immunoblots and densitometric analysis of SM22α, SM-MHC, vimentin, osteopontin, and β-actin (n = 5). (C) Representative immunoblots and densitometric analysis of FAK, Src, ERK1/2, p38, GSK3β, β-catenin, and β-actin after 30 minutes of PDGF-BB stimulation (n = 4/group). Nuclear extracts were prepared after 6 hours of PDGF-BB stimulation. β-Catenin and Lamin B1 were detected by immunoblotting (n = 4/group). Values are expressed as mean ± SEM. Statistical analysis: 2-way ANOVA followed by Fisher’s LSD test. *P < 0.05.
Figure 7
Figure 7. Infusion of anti–integrin α9 antibody reduces injury-induced neointimal hyperplasia in WT mice.
Serum-starved SMCs from WT mice were pretreated with murine specific anti-α9 blocking antibody (clone 55A2C, 10 μg/mL) for 60 minutes and then stimulated with or without PDGF-BB for 24 hours. (A) The top panels show representative BrdU-positive (red) cells costained with αSMA (green) and Hoechst (blue). Scale bars: 50 μm. The bottom panels show representative phase-contrast images of SMC migration in the scratch assay. Scale bars: 500 μm. The right panel shows the quantification of BrdU-positive cells to the total number of cells (n = 5) and migrated area (n = 6). (BD) Male WT mice were treated with 55A2C (200 μg/mouse) or control Ig. Wire injury was performed in the carotid artery after 60 minutes, and arteries were harvested after 28 days. (B) The left panels show representative photomicrographs of Verhoeff’s van Gieson–stained carotid artery sections. Scale bars: 200 μm. The right panels show quantification of intimal area, medial area, and a ratio of intimal to medial area. Each dot represents a single mouse (n = 8–9/group). (C) The left panels show representative BrdU-positive cells (red) counterstained with αSMA (green). Nuclei are counterstained with Hoechst (blue). The right panel shows the quantification of percentage BrdU-positive cells (n = 6). Scale bars: 200 μm. (D) The left panels show representative TUNEL-positive cells (green) counterstained with Hoechst (blue). The right panel shows the quantification of TUNEL-positive cells (n = 6). Scale bars: 200 μm. Values are represented as mean ± SEM. Statistical analysis: (A) 1-way ANOVA with Bonferroni’s post hoc test; (BD) unpaired 2-tailed Student’s t test. *P < 0.05 vs. quiescent or vehicle-treated (control Ig) groups. (E) Schematic showing the mechanism by which SMC-specific integrin α9 mediates SMC proliferation, migration, and neointimal hyperplasia.

References

    1. Alfonso F, et al. Current treatment of in-stent restenosis. J Am Coll Cardiol. 2014;63(24):2659–2673. doi: 10.1016/j.jacc.2014.02.545. - DOI - PubMed
    1. Aoki J, Tanabe K. Mechanisms of drug-eluting stent restenosis. Cardiovasc Interv Ther. 2021;36(1):23–29. doi: 10.1007/s12928-020-00734-7. - DOI - PubMed
    1. Shlofmitz E, et al. Restenosis of drug-eluting stents: a new classification system based on disease mechanism to guide treatment and state-of-the-art review. Circ Cardiovasc Interv. 2019;12(8):e007023. - PubMed
    1. Gupta SK, Vlahakis NE. Integrin alpha9beta1: unique signaling pathways reveal diverse biological roles. Cell Adh Migr. 2010;4(2):194–198. doi: 10.4161/cam.4.2.10900. - DOI - PMC - PubMed
    1. Barczyk M, et al. Integrins. Cell Tissue Res. 2010;339(1):269–280. doi: 10.1007/s00441-009-0834-6. - DOI - PMC - PubMed

Publication types