Neuropeptides in the developing human hippocampus under hypoxic-ischemic conditions
- PMID: 34028021
- PMCID: PMC8450465
- DOI: 10.1111/joa.13458
Neuropeptides in the developing human hippocampus under hypoxic-ischemic conditions
Abstract
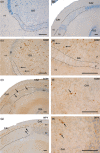
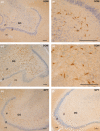
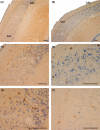
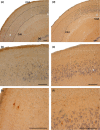
The perinatal period, sensitive for newborn survival, is also one of the most critical moments in human brain development. Perinatal hypoxia due to reduced blood supply to the brain (ischemia) is one of the main causes of neonatal mortality. Brain damage caused by perinatal hypoxia-ischemia (HI) can lead to neuro- and psychological disorders. However, its impact seems to be region-dependent, with the hippocampus being one of the most affected areas. Among the neuronal populations of the hippocampus, some interneuron groups - such as somatostatin- or neuropeptide Y-expressing neurons - seem to be particularly vulnerable. The limited information available about the effects of HI in the hippocampus comes mainly from animal models and adult human studies. This article presents an immunohistochemical analysis of somatostatin (SOM) and neuropeptide Y (NPY) expression in the developing human hippocampus after perinatal HI. Two rostrocaudal sections of the body of the hippocampus were analysed, and the number of immunostained cells in the polymorphic layer of the dentate gyrus (DG) and the pyramidal cell layer and stratum oriens of the CA3, CA2 and CA1 fields of the hippocampus proper were quantified. The results showed a lower density of both neuropeptides in hypoxic compared to control cases. In the HI group, the number of SOM-immunoreactive cell bodies was statistically significantly lower in the pyramidal cell layer and stratum oriens of CA1, while the number of NPY-expressing neurons was statistically lower in the pyramidal cell layer of CA2. Besides, the number of SOM-expressing neurons was significantly higher in the stratum oriens of CA1 compared to that in CA2. In sum, we observed a different vulnerability of SOM- and NPY-containing neurons in the developing human hippocampus following perinatal HI damage. Our results could contribute to a better understanding of the behaviour of these neuronal populations under stressful conditions during the perinatal period.
Keywords: brain development; hippocampus; hypoxia-ischemia; neuropeptide Y; somatostatin.
© 2021 The Authors. Journal of Anatomy published by John Wiley & Sons Ltd on behalf of Anatomical Society.
Conflict of interest statement
The authors declare no conflicts of interest.
Figures


Similar articles
-
Distribution of peptidergic populations in the human dentate gyrus (somatostatin [SOM-28, SOM-12] and neuropeptide Y [NPY]) during postnatal development.Cell Tissue Res. 2014 Oct;358(1):25-41. doi: 10.1007/s00441-014-1929-2. Epub 2014 Jun 26. Cell Tissue Res. 2014. PMID: 24965867
-
Functional changes in somatostatin and neuropeptide Y containing neurons in the rat hippocampus in chronic models of limbic seizures.Epilepsy Res. 1996 Dec;26(1):267-79. doi: 10.1016/s0920-1211(96)00059-9. Epilepsy Res. 1996. PMID: 8985706
-
Somatostatin- and neuropeptide Y-like immunoreactivity in the dentate area, hippocampus, and subiculum of the domestic pig.J Comp Neurol. 1992 Aug 15;322(3):390-408. doi: 10.1002/cne.903220308. J Comp Neurol. 1992. PMID: 1355497
-
Interneurons in rat hippocampus after cerebral ischemia. Morphometric, functional, and therapeutic investigations.Acta Neurol Scand Suppl. 1993;150:1-32. Acta Neurol Scand Suppl. 1993. PMID: 7907456 Review.
-
Neuropeptides-immunoreactivity and their mRNA expression in kindling: functional implications for limbic epileptogenesis.Brain Res Brain Res Rev. 1996 Jun;22(1):27-50. Brain Res Brain Res Rev. 1996. PMID: 8871784 Review.
Cited by
-
Perinatal compromise affects development, form, and function of the hippocampus part one; clinical studies.Pediatr Res. 2024 Jun;95(7):1698-1708. doi: 10.1038/s41390-024-03105-7. Epub 2024 Mar 22. Pediatr Res. 2024. PMID: 38519794 Free PMC article. Review.
-
Early-stage effect of HIBD on neuro-motor function and organic composition of neurovascular units in neonatal rats.Front Neurosci. 2023 Nov 21;17:1242936. doi: 10.3389/fnins.2023.1242936. eCollection 2023. Front Neurosci. 2023. PMID: 38075277 Free PMC article.
-
Impact of hypoxia on the hippocampus: A review.Medicine (Baltimore). 2025 Mar 21;104(12):e41479. doi: 10.1097/MD.0000000000041479. Medicine (Baltimore). 2025. PMID: 40128035 Free PMC article. Review.
-
Study of the human hippocampal formation: a method for histological and magnetic resonance correlation in perinatal cases.Brain Imaging Behav. 2023 Aug;17(4):403-413. doi: 10.1007/s11682-023-00768-4. Epub 2023 Apr 6. Brain Imaging Behav. 2023. PMID: 37024762 Free PMC article.
-
Intraoperative Hypothermia Induces Vascular Dysfunction in the CA1 Region of Rat Hippocampus.Brain Sci. 2022 May 27;12(6):692. doi: 10.3390/brainsci12060692. Brain Sci. 2022. PMID: 35741578 Free PMC article.
References
-
- Almli, C.R., Levy, T.J., Han, B.H., Shah, A.R., Gidday, J.M. & Holtzman, D.M. (2000) BDNF protects against spatial memory deficits following neonatal hypoxia‐ischemia. Experimental Neurology, 166, 99–114. - PubMed
-
- Bering, R. & Johansen, F.F. (1993) Expression of somatostatin mRNA and peptide in rat hippocampus after cerebral ischemia. Regulatory Peptides, 49, 41–48. - PubMed
-
- Bird, C.M. & Burgess, N. (2008) The hippocampus and memory: insights from spatial processing. Nature Reviews Neuroscience, 9, 182–194. - PubMed
-
- Cebada‐Sanchez, S., Insausti, R., Gonzalez‐Fuentes, J., Arroyo‐Jimenez, M.M., Rivas‐Infante, E., Lagartos, M.J. et al. (2014) Distribution of peptidergic populations in the human dentate gyrus (somatostatin [SOM‐28, SOM‐12] and neuropeptide Y [NPY]) during postnatal development. Cell and Tissue Research, 358, 25–41. - PubMed
-
- Covenas, R., Gonzalez‐Fuentes, J., Rivas‐Infante, E., Lagartos‐Donate, M.J., Cebada‐Sanchez, S., Arroyo‐Jimenez, M.M. et al. (2014) Developmental study of the distribution of hypoxia‐induced factor‐1 alpha and microtubule‐associated protein 2 in children's brainstem: comparison between controls and cases with signs of perinatal hypoxia. Neuroscience, 271, 77–98. - PubMed
Publication types
MeSH terms
Substances
LinkOut - more resources
Full Text Sources
Other Literature Sources
Miscellaneous

