Review
. 2023 Jan;42(1):35-66.
doi: 10.1002/mas.21696. Epub 2021 May 24.

The development and application of matrix assisted laser desorption electrospray ionization: The teenage years

Affiliations
Review

The development and application of matrix assisted laser desorption electrospray ionization: The teenage years

Michael Caleb Bagley et al. Mass Spectrom Rev. 2023 Jan.

Abstract

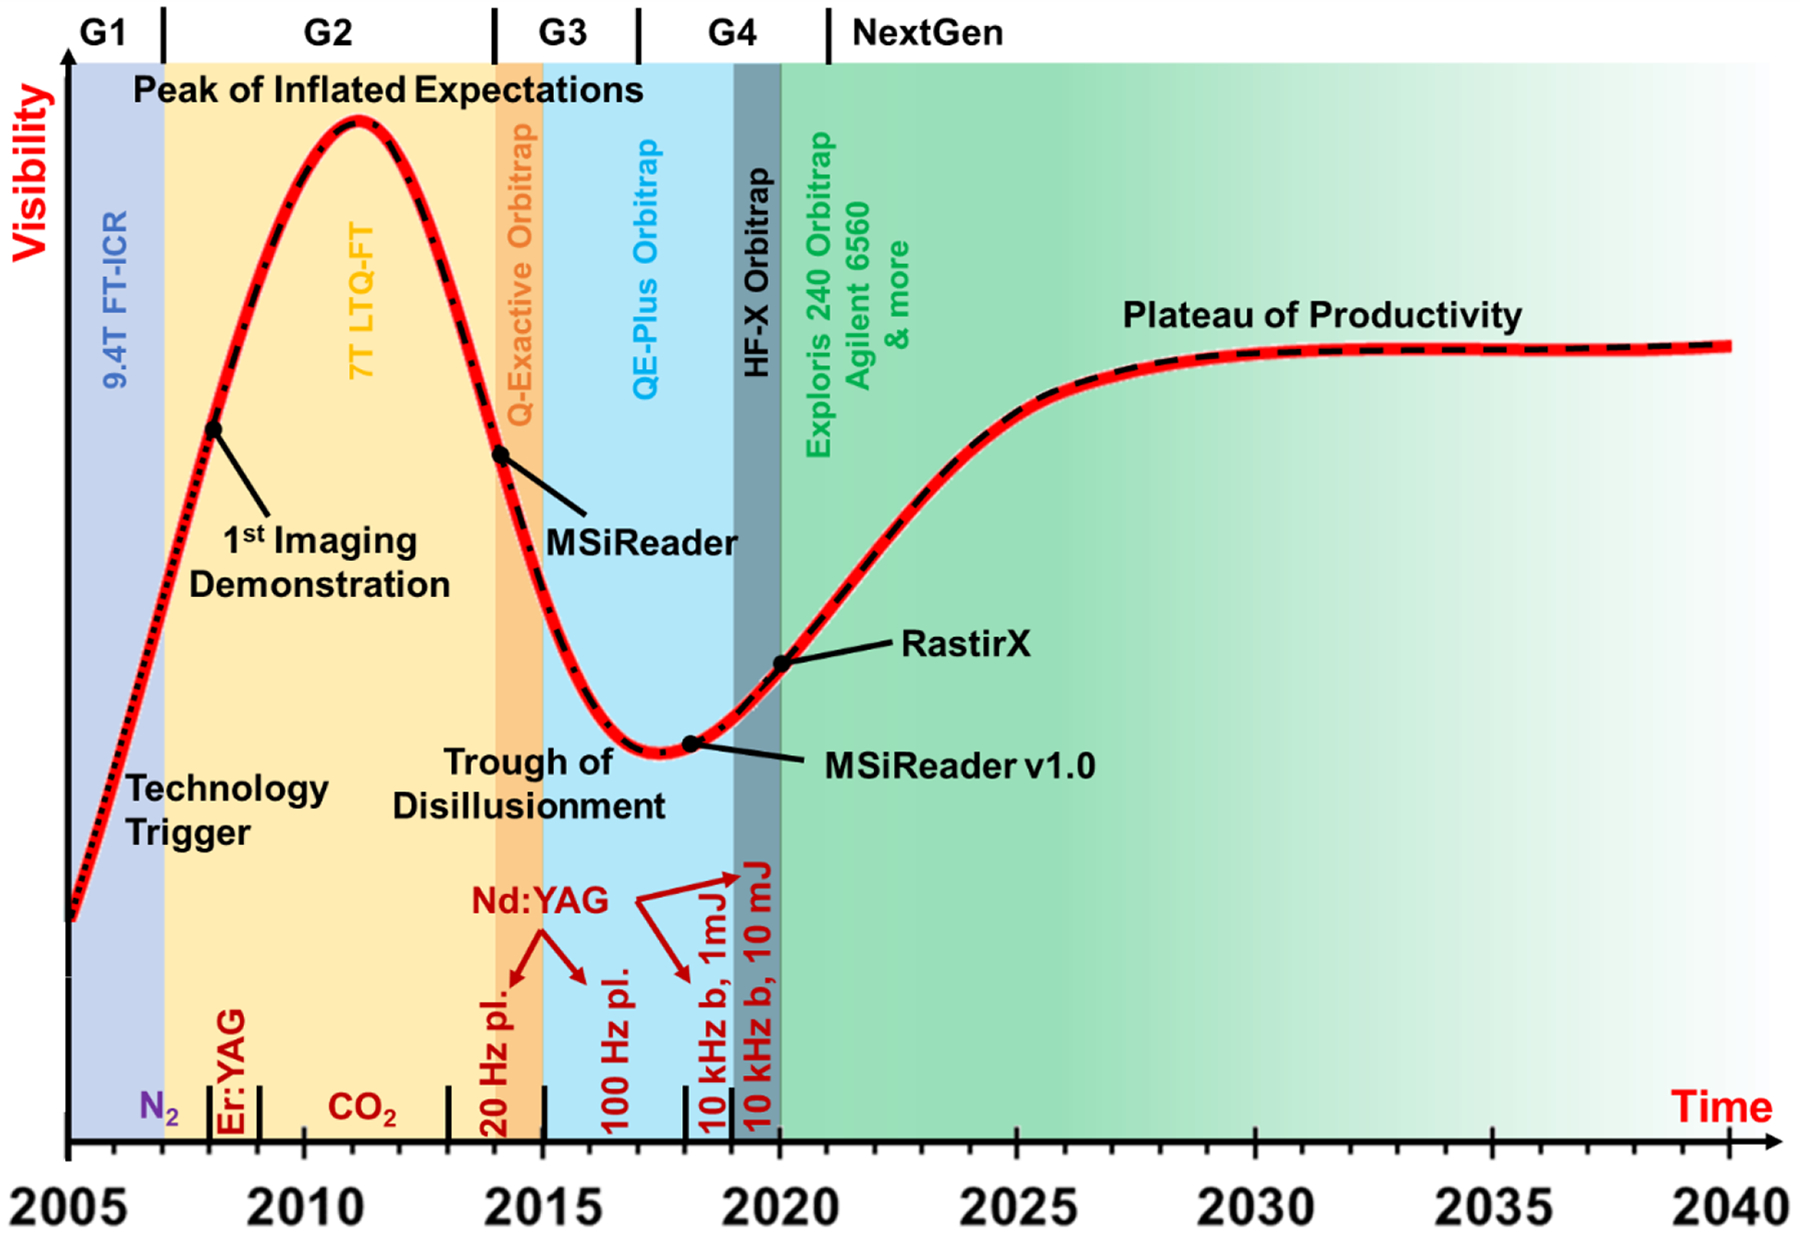
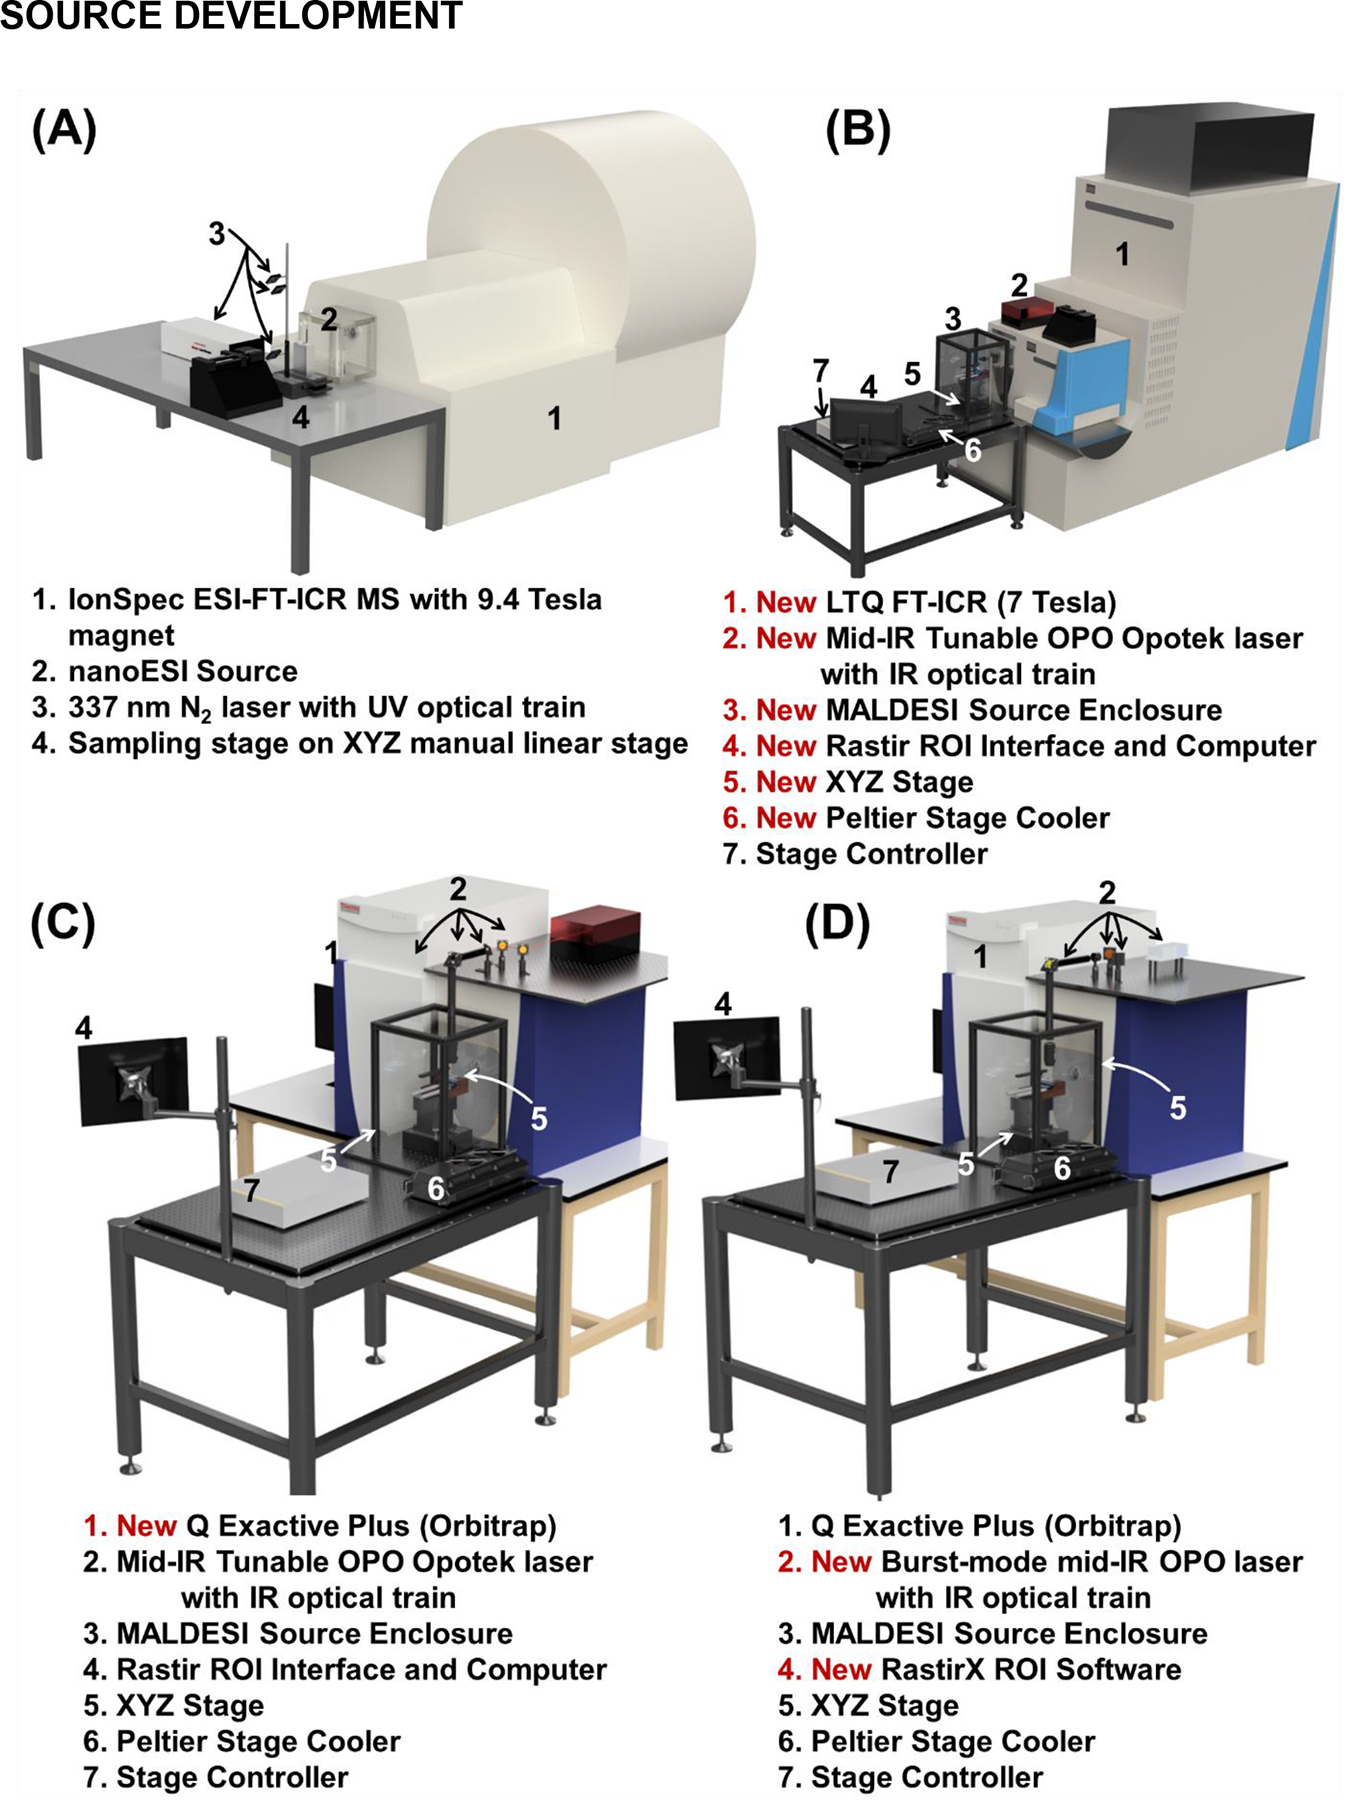
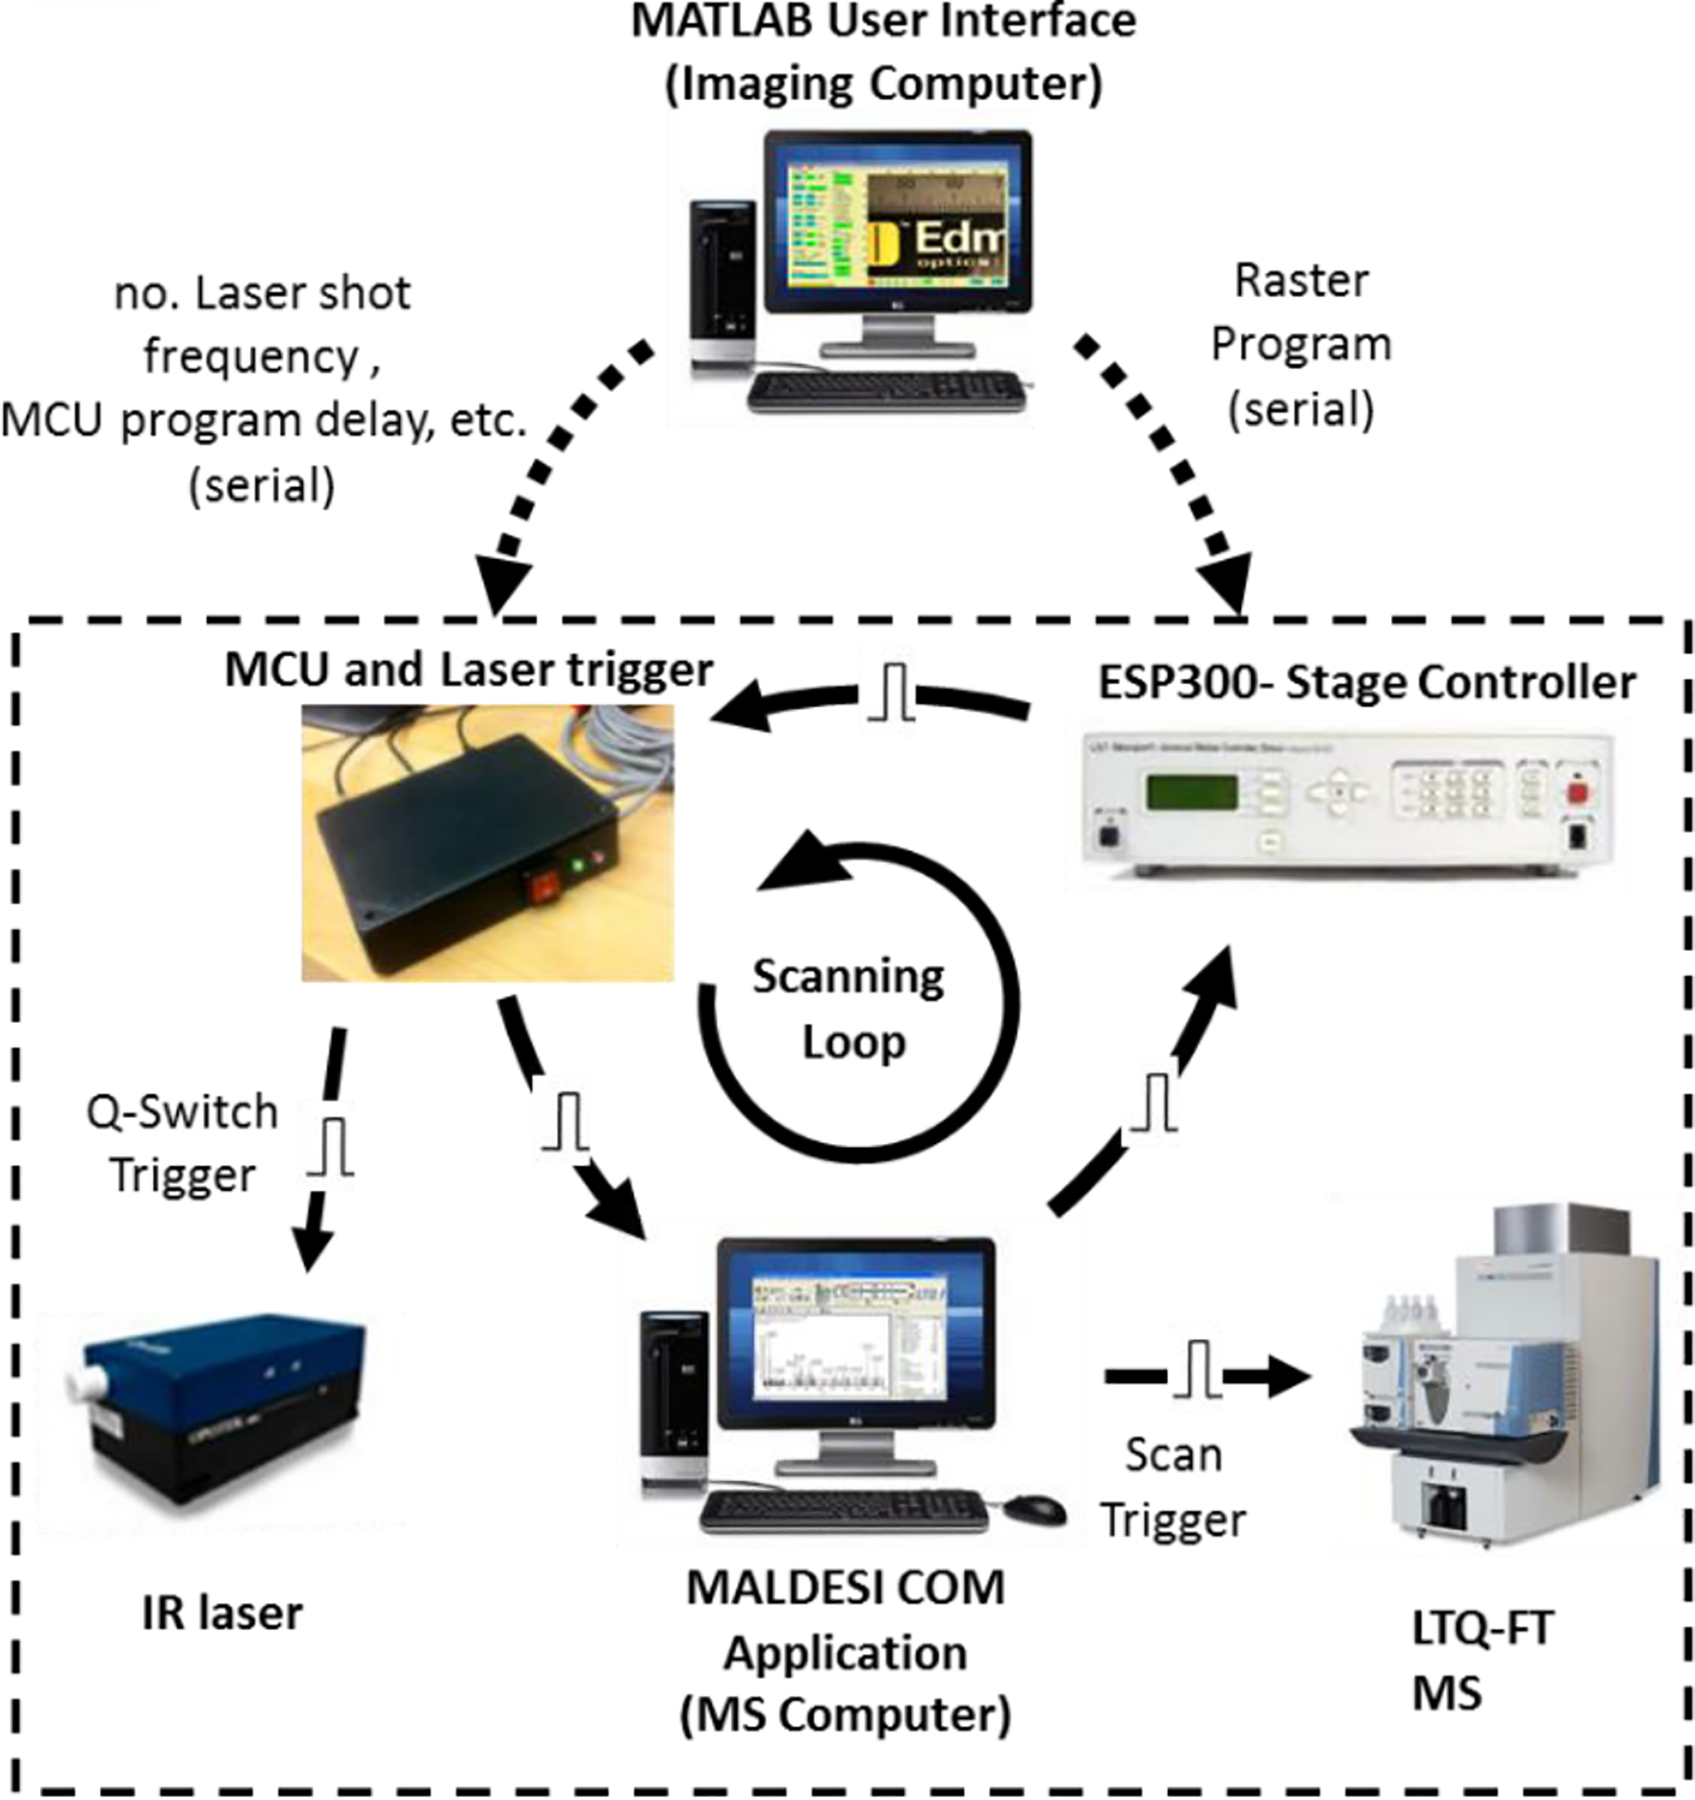
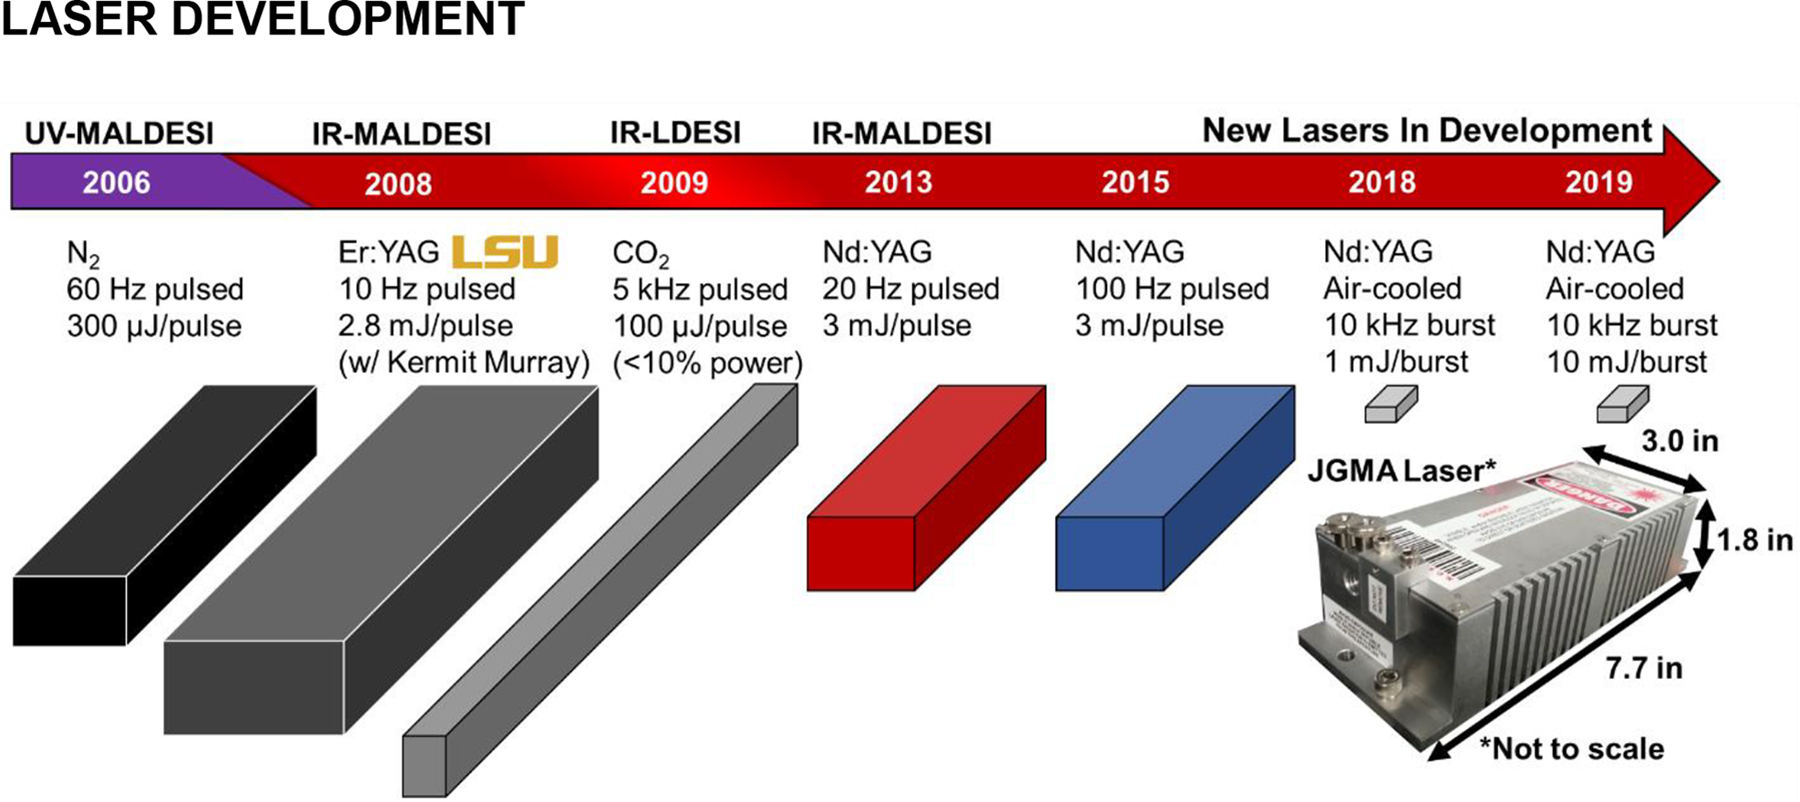
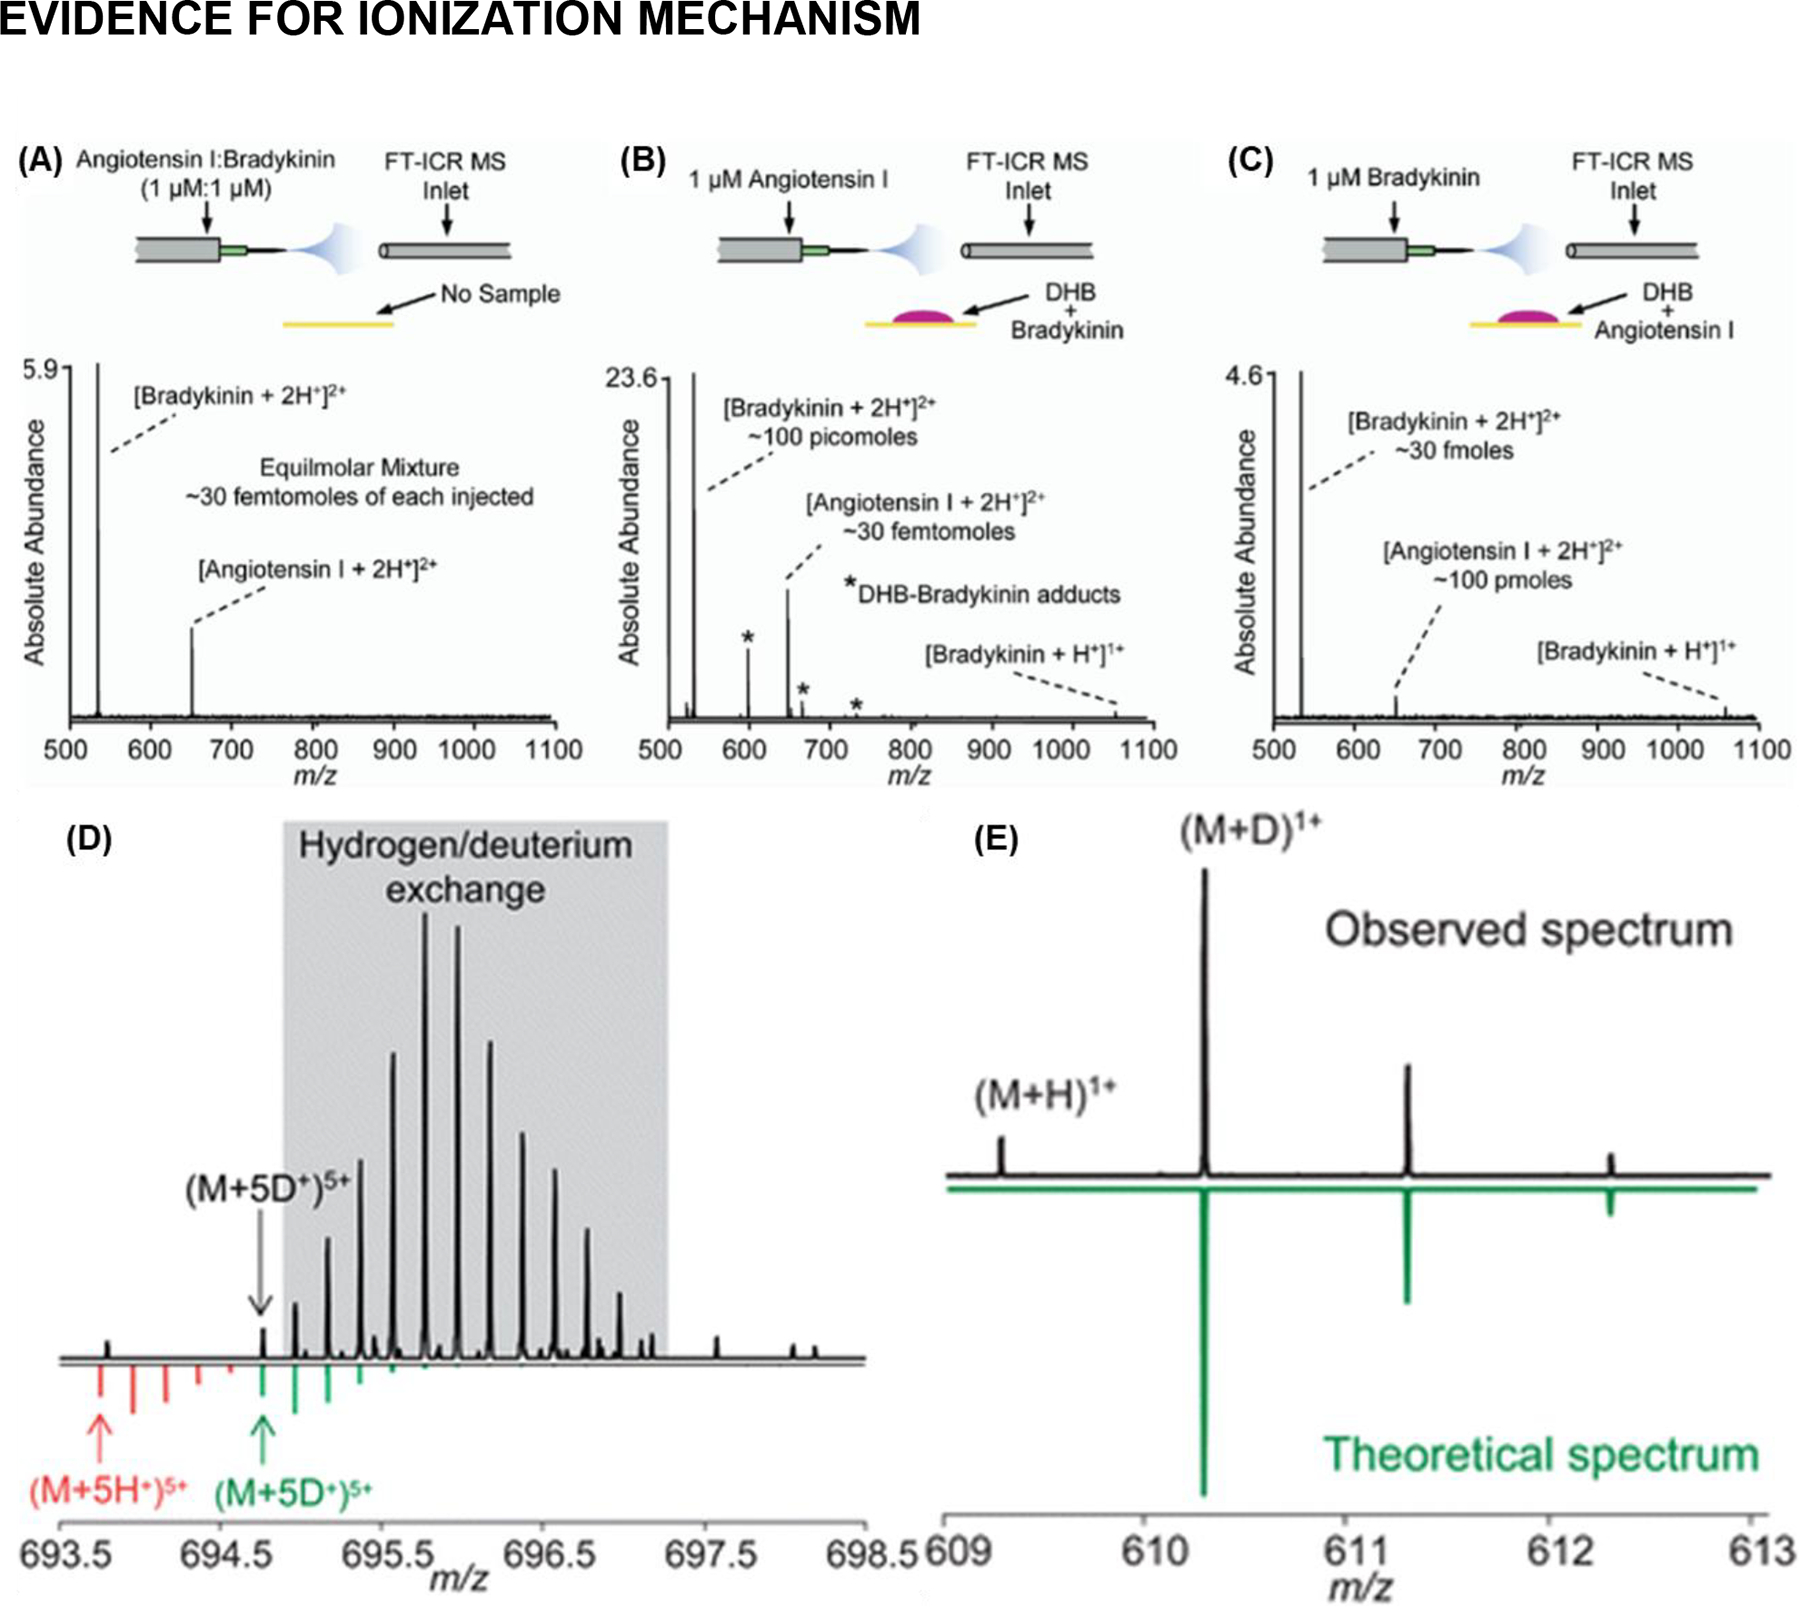
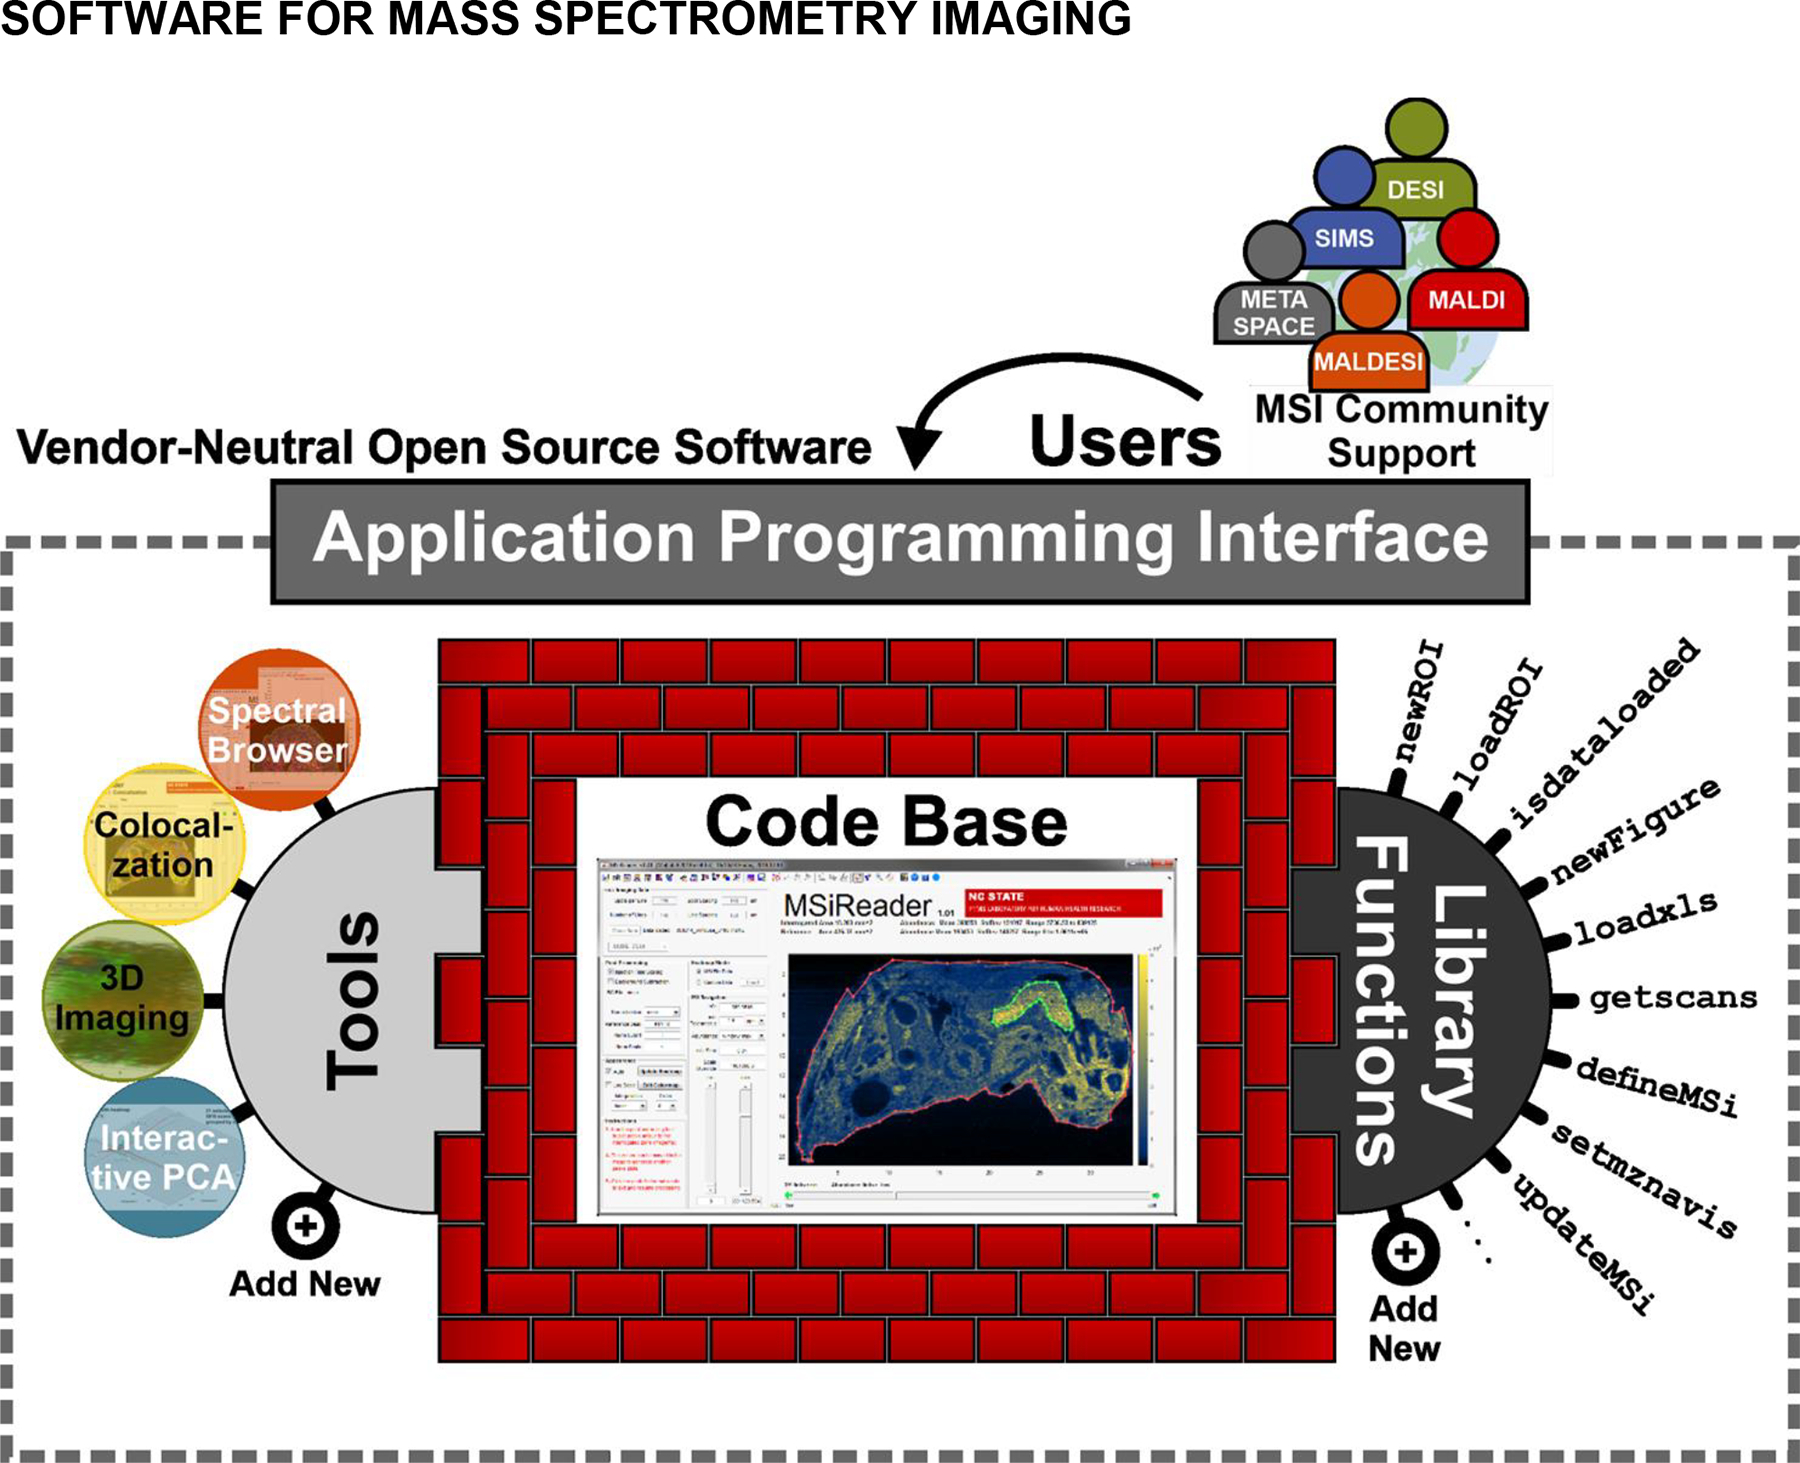
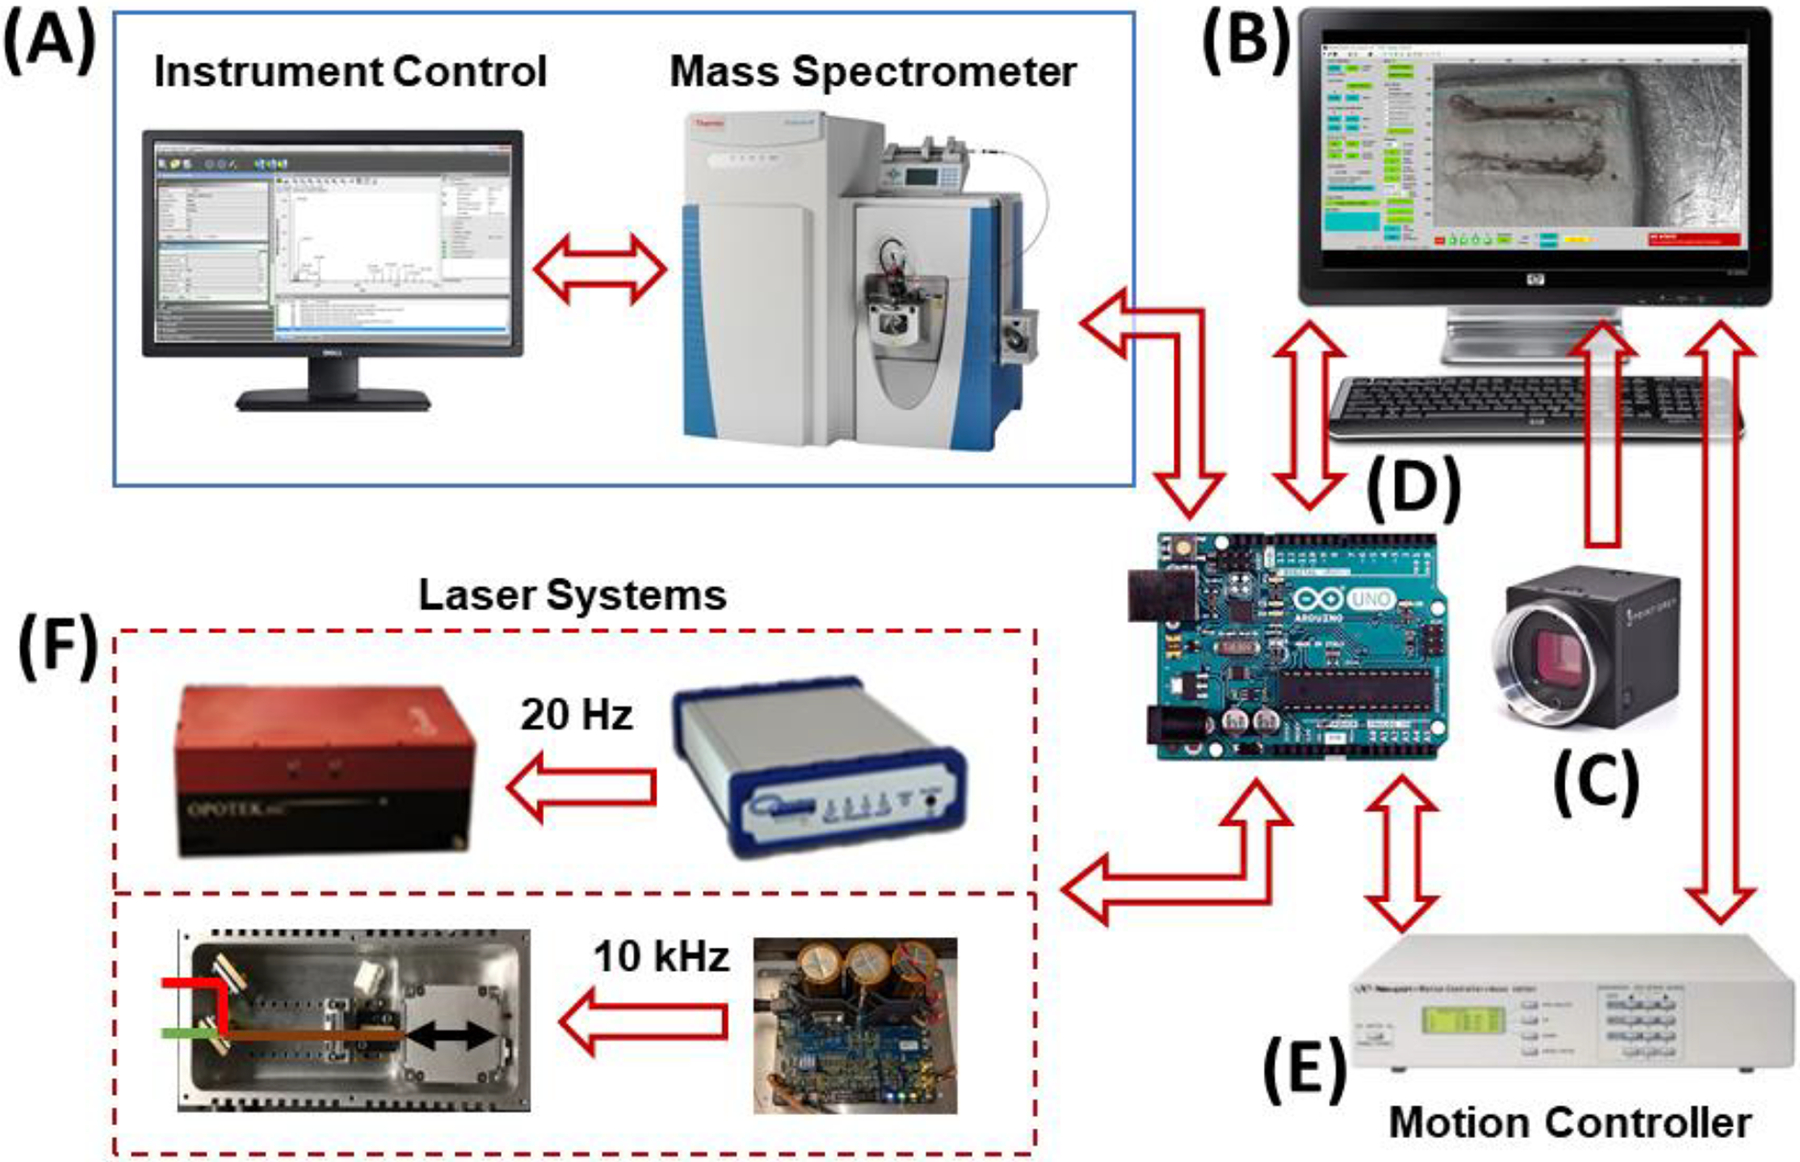
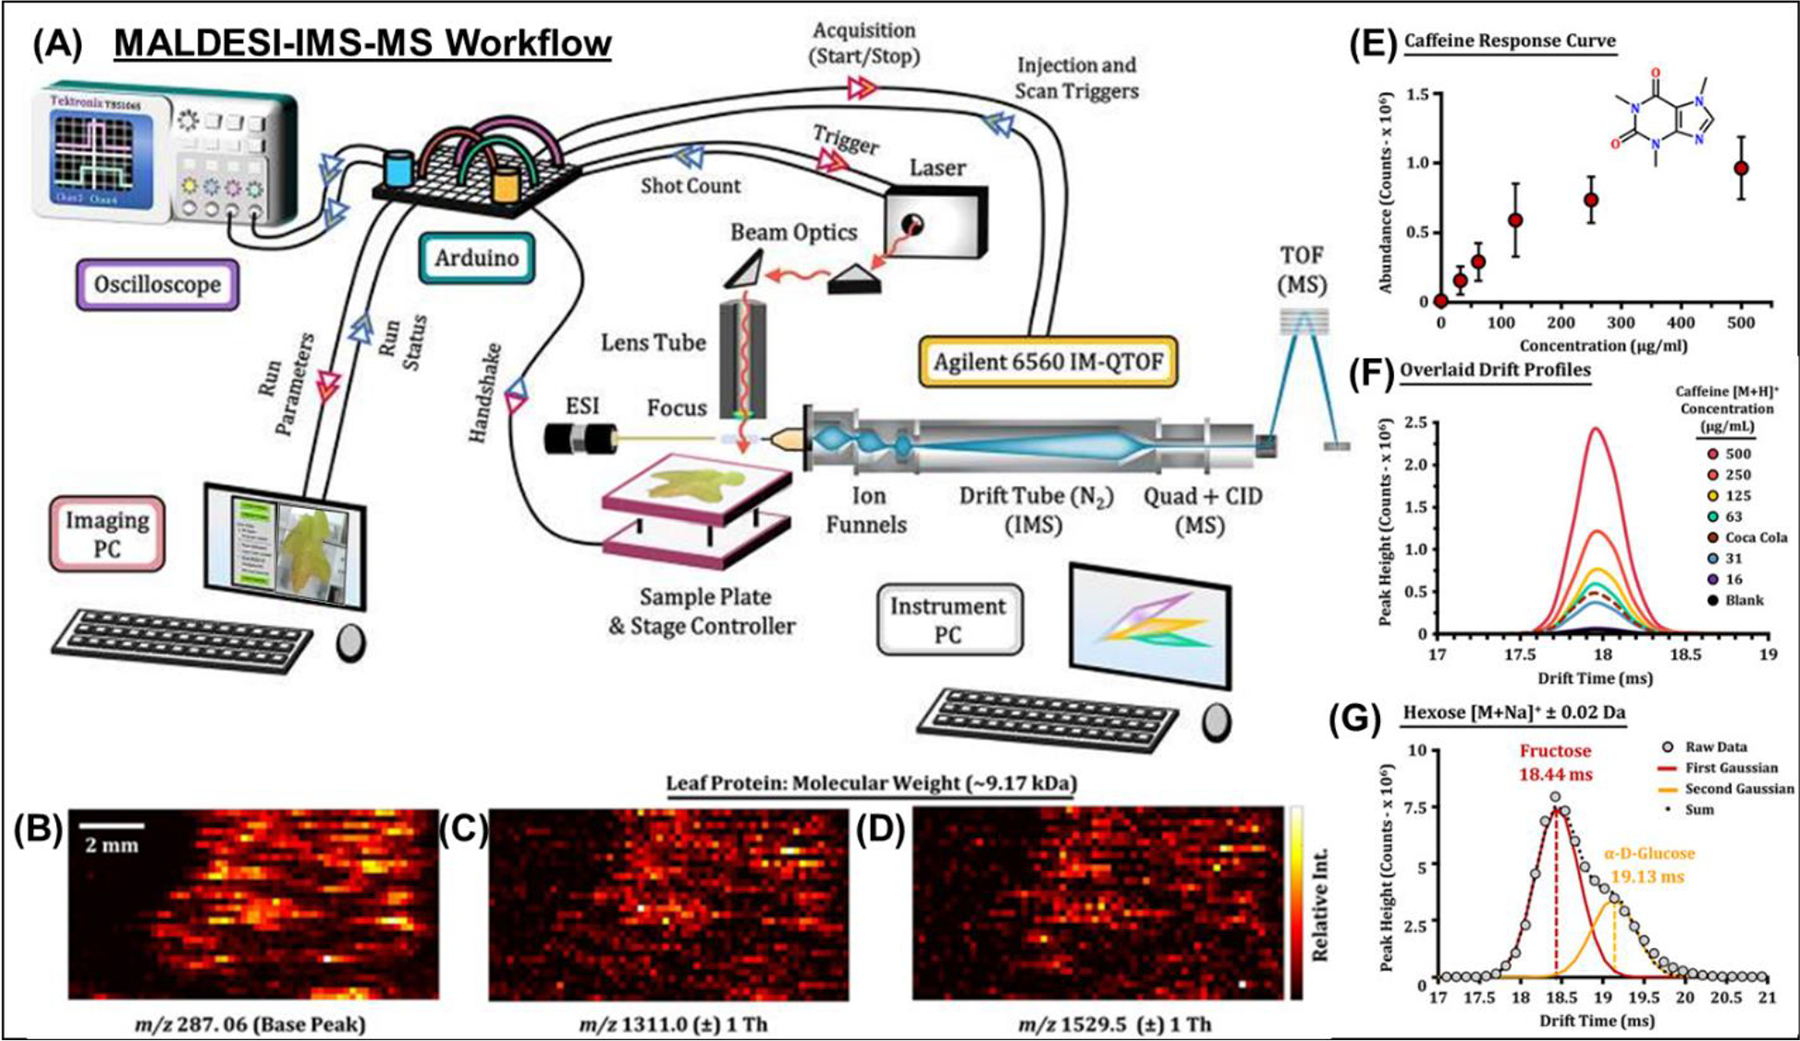
In the past 15 years, ambient ionization techniques have witnessed a significant incursion into the field of mass spectrometry imaging, demonstrating their ability to provide complementary information to matrix-assisted laser desorption ionization. Matrix-assisted laser desorption electrospray ionization is one such technique that has evolved since its first demonstrations with ultraviolet lasers coupled to Fourier transform-ion cyclotron resonance mass spectrometers to extensive use with infrared lasers coupled to orbitrap-based mass spectrometers. Concurrently, there have been transformative developments of this imaging platform due to the high level of control the principal group has retained over the laser technology, data acquisition software (RastirX), instrument communication, and image processing software (MSiReader). This review will discuss the developments of MALDESI since its first laboratory demonstration in 2005 to the most recent advances in 2021.

Keywords: FTMS; IR lasers; MALDESI; MSiReader; ambient ionization; direct analysis; mass spectrometry imaging.


Figures

Figure 1.
Figure 1.
The MALDESI ‘Hype Cycle.’ The chart above tracks MALDESI from its development (‘Technology Trigger’) to the future plateau of productivity. The color-coded background specifies which mass spectrometry platform the source was coupled to for the years it covers on the horizontal axis. The small, dotted line represents the pre-imaging direct analysis and fundamentals, while the dotted and dashed line shows the optimal mixture of imaging, direct analysis and continued focus on fundamentals that characterizes MALDESI’s present and future. Then, once the fundamentals have been reasonably understood, imaging/direct analysis are the focuses during the dashed line to demonstrate its versatility and productivity. Key moments in the lifespan of MALDESI are shown on the chart, including laser technology at the bottom. The ‘Trough of Disillusionment’ was the result of wrestling with technological limitations, deepening the fundamental understanding of the technique and streamlining source engineering to advance the technique by lowering barriers to adoption by other labs.
Figure 2.
Figure 2.
The MALDESI source from its initial demonstration in 2005 (Generation 1, A) to early development from 2007–13 (Generation 2, B) to Orbitrap coupling (Generation 3, C) to the current generation (Generation 4, D) in 2020. The Generation 4 (D) MALDESI source has been coupled to an Exploris 240 (Orbitrap, which will likely be the main platform for the completely re-engineered and improved NextGen MALDESI source.
Figure 3.
Figure 3.
Communication between the different components of the MALDESI imaging source. Scanning parameters are selected in the Matlab user interface and sent to the stage controller and the MALDESI controller box. Communication between components in the dashed box (scanning loop) is then initiated. Communication sequence for one pixel (one cycle of scanning loop). Adapted by permission from Robichaud et al. (2013), copyright 2012 American Society for Mass Spectrometry. Adapted with permission from Robichaud et al. J. Am. Soc. Mass Spectrom 2013, 24, 1, 92–100. © 2013 American Chemical Society.
Figure 4.
Figure 4.
The development and application of different lasers for MALDESI. Their 3D footprints and key features are illustrated above to highlight the improvements in size and characteristics to make a more robust and agile system.
Figure 5.
Figure 5.
Evidence of ESI-like ionization in MALDESI. (A) NanoESI FT-ICR mass spectrum of an equimolar mixture of angiotensin I and bradykinin. (B) MALDESI of bradykinin and simultaneous nanoESI of angiotensin I. (C) MALDESI of angiotensin I and simultaneous nanoESI of bradykinin. Adapted with permission from Sampson et al., J. Am. Soc. Mass Spectrom, 2006, 17, 12, 1712–1716, © 2006 American Society for Mass Spectrometry. Published by Elsevier B.V. (D) The observed mass spectrum of the 5+ charge state of brain natriuretic peptide-32 (BNP-32); the gray region indicates portions of the isotopic distribution of the (M+5H+)5+ charge state of BNP-32; the green isotopic distribution is a theoretical isotopic distribution of the (M+5D+)5+ charge state of BNP-32. The extensive region for hydrogen/deuterium exchange resulted in follow up experiments illustrated in (E). On top the mass spectrum obtained while electrospraying deuterated solvents though Remote Analyte Sampling, Transport and Ionization Relay (RASTIR) source (Dixon et al., 2008) (Note: the original meaning here of RASTIR is different from the later developed Rastir imaging software); the most abundant peak is the monoisotopic peak for reserpine in the (M+D+)1+ form. On the right is the reflected theoretical mass spectrum of reserpine as a (M+D+)1+ ion. Adapted with permission from Dixon and Muddiman, Analyst, 2010, 135, 5, 880–882, © 2010 Analyst.
Figure 6.
Figure 6.
Survival yields of five BP cations versus IS-CID energies for IR-MALDESI analysis of (A) sprayed slides and (B) tissue sections on sprayed slides. The comparison of (C) Boltzmann’s sigmoidal curves and (D) Internal Energy distributions between ESI and IR-MALDESI was made at 15 eV IS-CID. Adapted with permission from Tu and Muddiman, J. Am. Soc. Mass Spectrom 2019, 30, 11, 2380–2391 © 2019 American Chemical Society.
Figure 7.
Figure 7.
Dependence of Q Exactive Plus C-trap accumulation time on ambient and tissue-specific ion abundance during IR-MALDESI MSI analysis of ARV-incubated human cervical tissue. (A) MSI ion maps indicate increased ion abundance as C-trap inject time is reduced for: total ion current (150—600 m/z); ambient polydimethylcyclosiloxane (PDMS); endogenous cholesterol; and xenobiotic emtricitabine (FTC). (B) Normalized ion abundance for each analyte, including 95% confidence limit, showing 2–100 fold increase when reducing accumulation time from 110 ms (previous limiting conditions with 20 Hz laser) to 30 ms (100 Hz laser). Adapted with permission from Rosen et al., 2015, Anal Chem, 87, 20, 10483–10490, © 2015 American Chemical Society. (C) MSI of cholesterol in rat brain to illustrate the improved ion abundances when inject time was lowered from previously found optimum for two pulses firing at 20 Hz (A,B). (D) Graph showing the ion abundance dynamics of cholesterol with lines showing the timing of laser pulses and optimum resultant injection time. Adapted by permission from Springer Nature Customer Service Centre GmbH: Springer Analytical and Bioanalytical Chemistry IR-MALDESI method optimization based on time-resolved measurement of ion yields, M Ekelöf, DC Muddiman © 2018.
Figure 8.
Figure 8.
MSiReader supports and is driven by input from the MSI community. The MSiReader application programming interface also provides a structured framework for implementing new features and algorithms.
Figure 9.
Figure 9.
IR-MALDESI System Components. (A) RastirX is agnostic with respect to the mass spectrometer, provided there are two “handshake” signals: one to trigger scan acquisition and another indicating that the instrument is ready to acquire a scan. The voltage and polarity of these signals for various instruments is easily accommodated with opto-coupled relays and simple microprocessor (D) code changes. Mass Spectrometers interfaced to date include: Thermo Fisher Scientific LQT-FT-ICR Ultra, Q Exactive, Q Exactive Plus, Q Exactive HF-X, and Exploris 240, and Agilent 6560 IM-QTOF. (B) The RastirX user interface computer is any Windows PC with Matlab R2014a or later and the Image Processing and Image Acquisition toolboxes. RAM and HD (or SSD) requirements are modest – 8GB and 250GB, respectively. At least 3 USB ports are needed for communication with the video camera (C), microcontroller (D) and motion control system (E). (C) A video camera with fixed focal length lens. 4K DCI resolution is desirable although any USB camera recognized by the Image Acquisition toolbox will work, as will any webcam. (D) An Arduino Uno microcontroller for synchronization of the laser, stage controller, and mass spectrometer. A very simple custom shield has been built for interfacing TTL I/O pins with the mass spectrometer. (E) A motion controller. Currently a Newport ESP300 is connected to a USB serial port on the user interface PC (B) to send commands and report current position and system status. TTL level signals are sent to and received from the microcontroller (D). (F) A mid-IR laser. Two laser systems are shown: a 20 Hz pulse rate Opotek Q-switched, tunable laser (2700 – 3100 nm wavelength) along with a Quantum Composers Sapphire 9200 pulse generator for precision triggering (upper), and a 10 kHz pulse rate JGMA laser (2970 wavelength) with a DM-100 power supply/pulse generator (lower). A menu selection in the RastirX interface is used to indicate which laser is installed. Adapted with permission from Garrard et al., J. Am. Soc. Mass Spectrom 2020, 31, 12, 2547–2552 © 2020 American Chemical Society.
Figure 10.
Figure 10.
Demonstration of the value of RastirX on mouse bones. (A) ROI Editor polygon tool can be used to draw any closed polygon inside the rectangular ROI to delimit the area of the sample that is imaged. The polygon can be edited and moved after it is drawn. When the ROI Editor is launched, the last saved polygon can be recovered, or the user can draw a new one. (B) Further refinement of the ROI can be made using the mask editor and mouse to include or exclude any pixel in the rectangular ROI. (C) Motion path and the pixels that are imaged can be plotted by RastirX. Adapted with permission from Garrard et al., J. Am. Soc. Mass Spectrom 2020, 31, 12, 2547–2552 © 2020 American Chemical Society.
Figure 11.
Figure 11.
IR-MALDESI MSI analysis of cervical tissues incubated in either a low or high concentration of three HIV drugs: emtricitabine (FTC), tenofovir (TFV), and raltegravir (RAL). (A) Three different tissue thicknesses were investigated (10, 25, and 50 μm). The ion maps for all three drugs at each tissue thickness are shown on the same intensity scale to highlight relative differences in abundance. (B) Plot of the low to high concentration ratios of all three drugs across the three tissue thicknesses that were investigated. (C) Plot of the data from both methods (LC-MS/MS versus IR-MALDESI). A slope near 1 indicates relatively good agreement between the results from the LC-MS/MS and IR-MALDESI MSI experiments. Adapted with permission from Barry et al., J. Am. Soc. Mass Spectrom 2014, 25, 12, 2038–2047 © 2014 American Chemical Society.
Figure 12.
Figure 12.
Summary for quantitative IR-MALDESI MSI of FTC in tissue. (A) Workflow for quantitative IR-MALDESI MSI. (B) Ion map of [FTC+Na+]+ / [3TC+Na+]+ representing abundance of incubated FTC in the tissue section. The average ratio was 0.728. (C) Ion map of [13C15N2-FTC+Na+]+ / [3TC+Na+]+ representing the calibration curve at 0, 0.25, 0.5, 1, 2, 4, 6, and 8 μg/mL solution. (D) Resulting calibration curve generated from 13C15N2-FTC showing good linearity with R 2 = 0.9973. The calculated tissue concentration was near the center of the calibration range. (E) Summary of values used to generate the total amount of drug present in tissue section. Using the average ratio and the equation of the calibration curve returns a value of the FTC concentration in tissue in picograms per square millimeter. Using the area of the tissue, the total amount of FTC in the section was determined to be 24.0 ng. Adapted by permission from Springer Nature Customer Service Centre GmbH: Springer Analytical and Bioanalytical Chemistry Quantitative mass spectrometry imaging of emtricitabine in cervical tissue model using matrix-assisted laser desorption electrospray ionization, MT Bokhart, E Rosen, C Thompson, C Sykes, AD Kashuba, DC Muddiman © 2015.
Figure 13.
Figure 13.
MSI of antiretrovirals in hair to evaluate drug adherence. (A) IR-MALDESI response to [EFV + H]+ from strands (n = 4) of three dosed patients before (left) and after (right) oxidation of melanin by H2O2 indicating no significant degradation in response to EFV. (B) Top panel: ion map of [EFV + H]+ (left) and average longitudinal profile (right) for each of three patients, indicating a 4-fold difference in response to accumulated EFV in hair. Middle panel: Normalization of [EFV + H]+ response by [PTCA – H] results in similar longitudinal profiles for each of three patients to fixed-dose intake of EFV. Bottom panel: Comparative normalization approach for EFV, matching ionization mechanisms ([EFV – H]/PTCA – H]). Adapted with permission from Rosen et al., Anal Chem, 2016, 88, 2, 1336–1344, © 2015 American Chemical Society. (C) Ion image corresponding to cholesterol. (D) Ion image from the same hair strands corresponding to maraviroc (corrected by IS). (E) Longitudinal profiles showing the intensity of maraviroc along the length of the hair strands in panel D. Each of the profiles were smoothed by moving average (n = 3). The top profile corresponds to the top strand in the image. Adapted with permission from Gilliland et al., Anal Chem, 2019, 91, 16, 10816–10822 © 2019 American Chemical Society.
Figure 14.
Figure 14.
Underivatized neurotransmitters were analyzed in rat brains and rat placenta. Ion abundance in the (A) caudate putamen for GABA represented as (B) ion heat maps (m/z 104.0710) normalized to their SIL isotopes. The inset abundance charts demonstrate an example of the difference between bright and dark voxels in the images. The top row of each image set are female samples, the bottom row are males. The left columns are untreated rats, the right columns are treated rats. The red dashed box shows the region of the brain sample that was analyzed. Adapted by permission from Springer Nature Customer Service Centre GmbH: Springer Analytical and Bioanalytical Chemistry IR-MALDESI mass spectrometry imaging of underivatized neurotransmitters in brain tissue of rats exposed to tetrabromobisphenol A, MC Bagley, M Ekelöf, K Rock, H Patisaul, DC Muddiman © 2018. (C) Optical image of the rat placenta depicting the maternal, trophospongium, and fetal regions. (D) Spatial distributions of neurotransmitters in placenta tissue as a function of exposure. All four of these neurotransmitters are localized across the whole placenta. While dopamine and norepinephrine appear to be unaffected by exposure levels, serotonin and tyramine have lower normalized abundance in the BZ-54 and high FM550 exposure groups compared with the control group. The BZ-54, high FM550, low FM550, and control exposure groups received a total of 1000 mg BZ-54, 110 mg FM550, 100 mg FM550, and 0 mg FM550, respectively. Dotted white line is used to separate BZ-54 from FM550 exposed tissues. Adapted by permission from Springer Nature Customer Service Centre GmbH: Springer Analytical and Bioanalytical Chemistry Analysis of neurotransmitters in rat placenta exposed to flame retardants using IR-MALDESI mass spectrometry imaging, CL Pace, B Horman, H Patisaul, DC Muddiman © 2020.
Figure 15.
Figure 15.
IR-MALDESI mass spectrum of N-linked glycans in negative mode with their experimental m/z shown below each putative identification. These N-linked glycans were detected as glycosylamines, which is discussed in more detail below. Putative structures were assigned based on accurate mass and literature-based characterizations and are heavily composed of sialic acid residues (purple diamonds). Adapted with permission from Pace and Muddiman, J. Am. Soc. Mass Spectrom 2020, 31, 8, 1759–1762 © 2020 American Chemical Society.
Figure 16.
Figure 16.
IR-MALDESI Analyses of Glandular Trichome-free Leaves. (A) IR-MALDESI ion abundance map from 200 to 300 Th demonstrates the localization of artemisinin and its related metabolites in glandular trichome (GT)-free leaves. Ions are highlighted in red and are shown in the text above the heatmaps. From left to right: artemisinic acid [M+H-H2O]+, arteannuin B [M+H-H2O]+, artemisinic acid [M+H]+, arteannuin B [M+H]+, artemisinin [M+H-H2O]+, dihydroartemisinin [M+H-H2O]+, artemisinin [M+H]+, dihydroartemisinin [M+H]+. The ion abundance map for dihydroartemisinin [M + H]+ is connected by dashed red lines, which indicates that it colocalizes with several pixel groups of artemisinin [M+H]+. (B) Spectra of fragments associated with MS/MS fragmentation of the artemisinin precursor (283.1540 m/z) and monitored by PRM were obtained from artemisinin in the leaf section of A. annua shown in the insert. Fragment peaks identified by analysis of the artemisinin standard are highlighted with red lines. All m/z values are reported with ±2.5 ppm specificity. (C) Ion distribution heatmaps correlate by letter to the artemisinin fragments. The sampling area shown in the distribution heatmaps is correlated to the area within the box on the leaf section shown in (B), which lacks glandular trichomes. Adapted with permission from Judd et al., Mol. Plant, 2019, 12, 5, 704–714, © 2019 Elsevier B.V.
Figure 17.
Figure 17.
IR-MALDESI MSI of healthy and stroke-affected mouse humeri embedded in Plaster of Paris. (A) Flash-freeze fresh bone; cut bone in half using cryomicrotome; place trimmed bone in a mold facing flat side down; affix bone to the mold using embedding material and wait until the material sets; pour the rest of the embedding material and smooth out the top surface with a blade. Finally, a representation of the ROI and direction of laser sampling. (B) Optical image (+40% brightness, +40% contrast) and ion heatmaps. Features from MS1 scans were putatively annotated using METASPACE annotation engine. Scale bar is 1.5 mm for both the bone image and ion distributions. Adapted with permission from Khodjaniyazova et al., Anal Methods, 2019, 11, 46, 5929–5938 © 2019 The Royal Society of Chemistry.
Figure 18.
Figure 18.
Three-dimensional demonstration of IR-MALDESI MSI performed on a pill. (A) Optical image of a full pill, where the z-resolution at different energy levels was determined. (B) Optical image of a pill trimmed in half for 2D and 3D MSI; small circles are due to MUPS formulation. (C) Schematic of a pellet and its components, where each color indicates different components. (D) Three-dimensional intensity maps for starch (m/z 163.0601), triethyl citrate (m/z 277.1282), and omeprazole (m/z 346.1220). Colocalization of three markers in the pill with laser spot size 80 μm and depth resolution 16.3 μm. Adapted with permission Bai et al., J. Am. Soc. Mass Spectrom 2020, 31, 2, 292–297 © 2020 American Chemical Society.
Figure 19.
Figure 19.
(A) Correlation of MSI images with H&E-stained histological image. Overlaid image of three putatively identified lipids (cholesterol at m/z 369.3516 in the green channel, S1P at m/z 446.2395 in the blue channel, TG at m/z 879.7436 in the red channel) shows a clear interface between the 7th and 8th layer as well as the 33rd and 34th layer. The estimated thickness of the epidermis and dermis agrees with the histological data. (B) 3D three-color overlaid image of cholesterol at m/z 369.3516 (green), S1P at m/z 446.2395 (blue), and TG at m/z 879.7436 (52:3) (red). The lateral resolution is 50 μm and the depth resolution 7 μm. The magenta color represents the concurrent presence of blue and red color. Adapted by permission from Springer Nature Customer Service Centre GmbH: Springer Analytical and Bioanalytical Chemistry Three-dimensional (3D) imaging of lipids in skin tissues with infrared matrix-assisted laser desorption electrospray ionization (MALDESI) mass spectrometry, H Bai, KE Linder, DC Muddiman © 2021.
Figure 20.
Figure 20.
MALDESI-IMS-MS workflow. (A) A diagram is shown illustrating the major components of the IMS-QTOF MS platform and the annotated connections to the Arduino microcontroller board used to control each acquisition. (B,C,D) Raster experiment with consecutive line scans of a locally sourced oak leaf. After sample collection, spectra were acquired using IR-MALDESI-IMS-MS and exported to MSiReader for data visualization. Ion heatmaps for the base peak and highly charged features are illustrated with corresponding mass spectra. (E) Average abundance evaluations for the [M + H]+ signal of caffeine summed for per concentration level (or 50 IMS acquisitions) with error bars illustrating one standard deviation. (F) IMS drift time profiles for each caffeine concentration level, including a solvent blank and undiluted Coca-Cola. (G) The drift time profile of the hexose sugar [M + Na]+ ion acquired from the Coca-Cola sample. Two Gaussian peaks were fit to the profile illustrating CCS values consistent with fructose and glucose in an abundance ratio of 68:32. Adapted with permission Ekelöf et al., J. Am. Soc. Mass Spectrom 2020, 31, 3, 642–650 © 2020 American Chemical Society.

Similar articles

Cited by

References

    1. Ai W, Nie H, Song S, Liu X, Bai Y, & Liu H. 2018. A versatile integrated ambient ionization source platform. J Am Soc Mass Spectrom 29:7:1408–1415. - PubMed
    1. Andrade FJ, Shelley JT, Wetzel WC, Webb MR, Gamez G, Ray SJ, & Hieftje GM. 2008. Atmospheric pressure chemical ionization source. 2. Desorption−Ionization for the direct analysis of solid compounds. Anal Chem 80:8:2654–2663. - PubMed
    1. Andrade FJ, Wetzel WC, Chan GC-, Webb MR, Gamez G, Ray SJ, & Hieftje GM. 2006. A new, versatile, direct-current helium atmospheric-pressure glow discharge. J Anal at Spectrom 21:11:1175–1184.
    1. Bagley MC, Ekelöf M, & Muddiman DC. 2020. Determination of optimal electrospray parameters for lipidomics in infrared-matrix-assisted laser desorption electrospray ionization mass spectrometry imaging. J Am Soc Mass Spectrom 31:2:319–325. - PMC - PubMed
    1. Bagley MC, Stepanova AN, Ekelöf M, Alonso JM, & Muddiman DC. 2020. Development of a relative quantification method for infrared matrix-assisted laser desorption electrospray ionization mass spectrometry imaging of arabidopsis seedlings. Rapid Commun Mass Spectrom 34:6:e8616. - PMC - PubMed

Publication types

MeSH terms

LinkOut - more resources