. 2021 Jun 22;15(6):9299-9327.
doi: 10.1021/acsnano.1c02495. Epub 2021 May 24.

Bottom-Up Assembled Photonic Crystals for Structure-Enabled Label-Free Sensing

Affiliations

Bottom-Up Assembled Photonic Crystals for Structure-Enabled Label-Free Sensing

Juan Wang et al. ACS Nano. .

Abstract

Photonic crystals (PhCs) display photonic stop bands (PSBs) and at the edges of these PSBs transport light with reduced velocity, enabling the PhCs to confine and manipulate incident light with enhanced light-matter interaction. Intense research has been devoted to leveraging the optical properties of PhCs for the development of optical sensors for bioassays, diagnosis, and environmental monitoring. These applications have furthermore benefited from the inherently large surface area of PhCs, giving rise to high analyte adsorption and the wide range of options for structural variations of the PhCs leading to enhanced light-matter interaction. Here, we focus on bottom-up assembled PhCs and review the significant advances that have been made in their use as label-free sensors. We describe their potential for point-of-care devices and in the review include their structural design, constituent materials, fabrication strategy, and sensing working principles. We thereby classify them according to five sensing principles: sensing of refractive index variations, sensing by lattice spacing variations, enhanced fluorescence spectroscopy, surface-enhanced Raman spectroscopy, and configuration transitions.

Keywords: limit of detection; optical label-free sensor; photonic crystals; photonic stop band; self-assembly; sensitivity; signal readout; slow light.


Conflict of interest statement

The authors declare no competing financial interest.

Figures

Figure 1
Figure 1
Optical properties of the PhCs. (a) Reflection spectra with tunable PSBs by control over the size of the PhC building blocks. The PhCs are assembled polystyrene nanoparticles of 258 nm (red curve) or 305 nm (black curve) diameter. Adapted from ref (9). Copyright 2012 American Chemical Society. (b) Simplified dispersion diagram of a PhC, showing the energy (E) of a photon vs the wave vector k, featuring a PSB. Alternating green–white lines represent the periodic structure of the PhCs, where green indicates a high index of refraction, while white indicates a low index of refraction. At the red edge of the PSB, the absolute value of the light field peaks in the dielectric regions with high refractive index (red curve), while at the blue edge of the PSB, the peaks in regions with low refractive index (blue curve). Reproduced from ref (29). Copyright 2003 American Chemical Society.
Figure 2
Figure 2
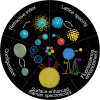
Schematic diagram of PhC-based sensors classified by their sensing mechanism as discussed in this review. Ex and Em represent the excitation frequency and emission frequency.
Figure 3
Figure 3
Schematic diagram and the corresponding SEM close-up images of the opal and inverse opal structures. (a) Opal PhC structure and (b) inverse opal PhC structure. The schematic in right panel shows the neck angle of the inverse opal structure, which determines the wettability of an inverse opal structure. The SEM image in (a) was adapted with permission from ref (4). Copyright 2020 Wiley. Panel (b) was reproduced from ref (84). Copyright 2011 American Chemical Society.
Figure 4
Figure 4
Refractive index variation-induced sensing by self-assembled PhCs. (a) Carbon-based inverse opals for oil sensing. (i) Reflection spectra and the optical microscopy images of carbon inverse opals upon infiltration with four different oils. (ii) PSB of the carbon inverse opals is a linear function of refractive indices. The pore diameters of the carbon-based inverse opals used are 215, 240, and 280 nm. Reproduced with permission from ref (79). Copyright 2008 Royal Society Chemistry. (b) SiO2-based inverse opal spheres for biomarker detection. (i) Optical response to an increase in target concentration. (ii) Multiplex immunoassays using inverse opal spheres with different PSBs. Reproduced with permission from ref (42). Copyright 2009 Wiley. (c) Hydrogel-based MIP inverse opals for protein detection. (i) Diagram of the fabrication procedure of MIP-functionalized hydrogel inverse opals. (ii) Bragg diffraction response of bovine Hb-immobilized hydrogel inverse opals to varying concentration of bovine Hb. (iii) Specificity demonstration of the MIP-immobilized hydrogel inverse opals. The x axis of concentration is in logarithmic scale. Reproduced with permission from ref (43). Copyright 2009 Wiley.
Figure 5
Figure 5
Dynamic sensing of solvents with similar or identical refractive indices using PhC gels. (a) Comparison of PhC gel sensing using SRS and DRS approaches. (b) DRS patterns of homologue alcohols. Reproduced with permission under a Creative Commons license from ref (88). Copyright 2015 Springer Nature.
Figure 6
Figure 6
Sensing by lattice spacing variations of PhCs. (a) Urease-immobilized hydrogel opal structures for detection of urea and Hg2+. (i) Diagram of sensing mechanism. (ii) Bragg diffraction peak shifts as a function of urea concentration. (iii) Optical reflection spectra of urease-immobilized hydrogel opals in the copresence of urea and Hg2+ with increasing Hg2+ concentration. Reproduced with permission from ref (95). Copyright 2011 Royal Society of Chemistry. (b) −SH spatially distributed hydrogel opals for Hg2+ sensing through formation of −S–Hg2+ and −S–Hg–S– bridges. The formation of −S–Hg–S– bridge bonds in seawater has a blue shift response due to the hydrogel shrinkage, while the formation of −S–Hg2+ in pure water has low Hg2+ concentration, leading to a swelling with a red shift. Modified with permission from ref (94). Copyright 2017 Royal Society of Chemistry. (c) Core–shell SPCs as a Hg2+ sensor. (i) Diagram of sensing principle. (ii) Reflection optical microscopy images and spectra of core–shell SPCs incubated in different concentrations of Hg2+. Reproduced with permission from ref (96). Copyright 2014 Wiley. (d) Poly(ionic liquid) inverse opal SPCs for visual identification of explosives. (i) Diagram of fabrication procedure. (ii) Photos and optical microscopy images of the SPCs before and after responding to five different explosives at 100 μM. (iii) 2D principle component analysis score plots to evaluate the discriminatory capacity of SPCs in response to different concentrations of picric acid (PA). Reproduced from ref (52). Copyright 2019 American Chemical Society. (e) Shape memory inverse opal structures for analyte detection. (i) Diagram of principle of shape memory inverse opal structures for ethanol analysis. (ii) Photos of the shape memory inverse opal structures (treated by acetonitrile causing structure collapse) and stepwise shape recovery in response to ethanol diffusion from solutions with different concentrations. Cross-sectional SEM images of the collapsed structures and the samples after recovery from ethanol–octane solutions with 2000, 4000, and 6000 ppm ethanol. (iii) Optical reflection spectra of partially recovered samples using ethanol–octane solutions with lower ethanol concentrations. Reproduced with permission from ref (98). Copyright 2018 Wiley.
Figure 7
Figure 7
Microcapsule sensor assembled by temperature-responsive core–shell colloids. By observing the color, the temperature can be revealed. (a) Microcapsule sensor fabrication principle by depletion-driven phase separation. (b) Thermochromic properties of microcapsules. Reproduced with permission from ref (55). Copyright 2018 Wiley.
Figure 8
Figure 8
Universal competition-based method for sensing using hydrogel PhCs. (a) Sensing principle using antibody–antigen interaction. Applying transient fixation of well-ordered, non-close-packed PhCs to a poly(vinyl alcohol) (PVA) polymer and covalent immobilization of acrylated antibodies–antigens to a PAM and subsequent PVA removal for fabrication of antibody–antigen grafted hydrogel PhCs. (b) Corresponding direct method for sensing. (c) PrtA sensor (IgG-protein-A-immobilized hydrogel) with obvious color changes in response to different concentrations of antigen. (d) Corresponding CIE (International Commission on Illumination) chromaticity diagram of the PrtA sensor in (c). Reproduced from ref (53). Copyright 2020 American Chemical Society.
Figure 9
Figure 9
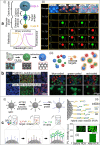
Multiplexed assays by enhanced fluorescence sensing. (a) Binary optical encoding system for multiplex assays. (i) Diagram of binary encoding strategy using SPCs and QDs via bridge of antigen–antibody complex (sandwich assay). (ii) Demonstration of multiplexed assays using this binary encoding strategy. The inset solid green and red circles represent the used type of QDs with green and red emission spectra, respectively. Reproduced from ref (119). Copyright 2011 American Chemical Society. (b) Hollow colloidal SPCs assembled from core–shell nanoparticles for miRNA detection. (i) Diagram of fabrication of hollow colloidal SPCs by droplet confinement-induced crystallization. (ii) Optical microscopy images of structural colors of SPCs assembled from solid PS@SiO2 colloids (top row) and the gas-filled SiO2NPs (bottom row). (iii) Diagrams of the hollow colloidal SPCs for multiplex miRNA detection and optical microscopy images of three groups of hollow colloidal SPCs after incubation with target miRNA molecules. Top row: bright-field images. Bottom row: corresponding fluorescence images. Reproduced with permission from ref (122). Copyright 2019 Wiley. (c) SPCs combined with a HCR method for detection of bladder cancer miRNAs. (i) Diagram of miRNA detection method using SPCs combined with HCR. (ii) Diagram of the HCR method. (iii) Decoding results of target miRNAs captured by SPCs before and after HCR. Reproduced from ref (109). Copyright 2020 American Chemical Society.
Figure 10
Figure 10
Diagram of label-free quantification of mycotoxins by a G-quadruplex structure and aptamer-immobilized SPCs. Reproduced from ref (129). Copyright 2020 American Chemical Society.
Figure 11
Figure 11
Diagram of microneedles (MNs) encoded with SPCs for ISF biomarker detection. Reproduced with permission from ref (59). Copyright 2019 Wiley.
Figure 12
Figure 12
PhCs serving as SERS-active substrates for chemical and/or biological sensing. (a) Diagram of PhC structures as templates for construction of hotspots for SERS. Left side: schematic of opals as templates for fabrication of SERS-active substrates. Right side: inverse opals used for SERS-active substrates, where the matrix can consist of hydrogels, metals, and inorganics. (b) Diagram of light localization and enhancement/suppression of Raman signal by PhCs. Left side: an overlapping of the excitation wavelength (λEx) with the red edge of the PSB, which can increase the localized EM field. Right side: light–matter suppression due to an overlapping of λEx and the PSB.
Figure 13
Figure 13
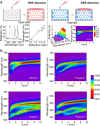
PhC structures used for chemical and/or biological sensing by SERS. (a) Tunable nanogaps between Au-coated SiO2NPs of SPCs for molecule detection by SERS with an EF of 7 orders of magnitude. Reproduced with permission from ref (150). Copyright 2017 Royal Society of Chemistry. (b) Inverse opal hydrogels with incorporated SERS nanotags (Raman dyes embedded core–shell Au@Ag nanoparticles) for biomarker detection with high sensitivity and a wide dynamic detection range. Reproduced from ref (67). Copyright 2018 American Chemical Society. (c) Plasmon-free inverse TiO2 PhCs for SERS with improved sensitivity according to the enhanced light–matter interaction. SEM images of inverse TiO2 PhCs with different size of their building blocks and corresponding reflection spectra, as well as Raman spectra (10–5 M methylene blue adsorbed on their structures for detection). Reproduced from ref (64). Copyright 2014 American Chemical Society. (d) Diagram of inverse opal hydrogels featuring AgNPs for multiplexed analysis of proteins by their Raman fingerprints. Reproduced with permission from ref (157). Copyright 2015 Wiley.
Figure 14
Figure 14
Biological PhCs serving as SERS-active substrates for sensing. (a) 3D Cu PhC structures replicated from butterfly wings by electroless deposition with varying periods (SEM images) for SERS with large-area production and low cost. Reproduced with permission from ref (161). Copyright 2012 Wiley. (b) Diatom PhC-enhanced plasmonic mesocapsules applied for optofluidic-SERS sensing. Reproduced with permission from ref (156). Copyright 2019 Wiley.
Figure 15
Figure 15
LC-based microdroplets as chemical and/or biological sensors. (a) NLC microdroplet-based virus/bacteria sensor with a bipolar to radial configuration transition. Reproduced with permission from ref (172). Copyright 2009 Wiley. (b) Enzyme-immobilized CLC microdroplets for detection of glucose and cholesterol. Reproduced from ref (183). Copyright 2016 American Chemical Society. (c) Polymer-caged NLC microcapsules with high stability for detection of amphiphiles. (i) Schematic of the polymer-caged NLC microcapsule fabrication procedures. (ii) Bright-field, polarized microscopy images and schematic illustrations of director configuration change of polymer-caged NLC microcapsules in response to the DTAB addition. (iii) Demonstration of LC droplet-based “test strips” consisting of dried caged NLCs that can be dipped into aqueous analyte solution, and the corresponding bright field and polarized microscopy images before insertion and after insertion into a DTAB solution. Reproduced from ref (185). Copyright 2015 American Chemical Society. (d) CLCsolid microspheres as solvent quality indicators and temperature sensors owing to the helical pitch change. (i) Optical microscopy of CLCsolid microspheres after chiral dopant extraction with red, green, and blue reflection colors at the center, corresponding to the CLC mixtures with increasing concentrations of chiral dopant. (ii) Diameter and calculated wavelength of CLCsolid microspheres in toluene as a function of the solvent temperature; insets show optical microscopy images and the cross-sectional SEM image of a CLCsolid. (iii) Diameter and calculated wavelength of the CLCsolid microspheres as a function of water content in a pyridine/water mixture at 24.0 °C; insets show the corresponding optical microscopy images. Reproduced with permission from ref (75). Copyright 2017 Royal Society of Chemistry. (e) Multisensor platform made of a PAA-interpenetrated CLCsolid microsphere (CLCsolid-PAA) patterned film. (i) Schematic of preparation of photonic CLCsolid-PAA microspheres in a patterned array film. (ii) Multianalyte sensing using the receptor-immobilized photonic CLCsolid-PAA microspheres. Reproduced from ref (69). Copyright 2020 American Chemical Society.
Figure 16
Figure 16
Fluorescent chiral PhC film used for multianalyte sensing. (a) Schematic of a straightforward coassembly process for fabrication of the fluorescent PhC film and the sensing mechanism to water and formaldehyde. (b) Optical responses of the PhC film to RH and formaldehyde. Humidity sensor: Photographs of films upon irradiating with white light (top row) and 365 nm UV (bottom row). Formaldehyde sensor: Photographs of the film upon UV radiation with 365 nm (top row from left to right with increasing formaldehyde concentration). The corresponding fluorescence spectra and the fluorescence intensity as a function of formaldehyde concentration at RH = 65% (bottom row). Reproduced from ref (74). Copyright 2020 American Chemical Society.

Similar articles

Cited by

References

    1. Ye J.; Ouyang S.; Chen X.; Kako T.; Zou Z.; Li Z. Enhanced Incident Photon-to-Electron Conversion Efficiency of Tungsten Trioxide Photoanodes Based on 3D-Photonic Crystal Design. ACS Nano 2011, 5, 4310–4318. 10.1021/nn200100v. - DOI - PubMed
    1. Liu J.; Zhao H.; Wu M.; Van der Schueren B.; Li Y.; Deparis O.; Ye J.; Ozin G. A.; Hasan T.; Su B. L. Slow Photons for Photocatalysis and Photovoltaics. Adv. Mater. 2017, 29, 1605349.10.1002/adma.201605349. - DOI - PubMed
    1. Burgess I. B.; Mishchenko L.; Hatton B. D.; Kolle M.; Loncar M.; Aizenberg J. Encoding Complex Wettability Patterns in Chemically Functionalized. J. Am. Chem. Soc. 2011, 133, 12430–12432. 10.1021/ja2053013. - DOI - PubMed
    1. Wang J.; Le-The H.; Shui L.; Bomer J. G.; Jin M.; Zhou G.; Mulvaney P.; Pinkse P. W. H.; van den Berg A.; Segerink L. I.; Eijkel J. C. T. Multilevel Spherical Photonic Crystals with Controllable Structures and Structure-Enhanced Functionalities. Adv. Opt. Mater. 2020, 8, 1902164.10.1002/adom.201902164. - DOI
    1. Hou J.; Li M.; Song Y. Patterned Colloidal Photonic Crystals. Angew. Chem., Int. Ed. 2018, 57, 2544–2553. 10.1002/anie.201704752. - DOI - PubMed

Publication types

LinkOut - more resources