

Geographical Disparities in HIV Seroprevalence Among Men Who Have Sex with Men and People Who Inject Drugs in Nigeria: Exploratory Spatial Data Analysis
- PMID: 34028360
- PMCID: PMC8185612
- DOI: 10.2196/19587
Geographical Disparities in HIV Seroprevalence Among Men Who Have Sex with Men and People Who Inject Drugs in Nigeria: Exploratory Spatial Data Analysis
Abstract
Background: The assessment of geographical heterogeneity of HIV among men who have sex with men (MSM) and people who inject drugs (PWID) can usefully inform targeted HIV prevention and care strategies.
Objective: We aimed to measure HIV seroprevalence and identify hotspots of HIV infection among MSM and PWID in Nigeria.
Methods: We included all MSM and PWID accessing HIV testing services across 7 prioritized states (Lagos, Nasarawa, Akwa Ibom, Cross Rivers, Rivers, Benue, and the Federal Capital Territory) in 3 geographic regions (North Central, South South, and South West) between October 1, 2016, and September 30, 2017. We extracted data from national testing registers, georeferenced all HIV test results aggregated at the local government area level, and calculated HIV seroprevalence. We calculated and compared HIV seroprevalence from our study to the 2014 integrated biological and behavioural surveillance survey and used global spatial autocorrelation and hotspot analysis to highlight patterns of HIV infection and identify areas of significant clustering of HIV cases.
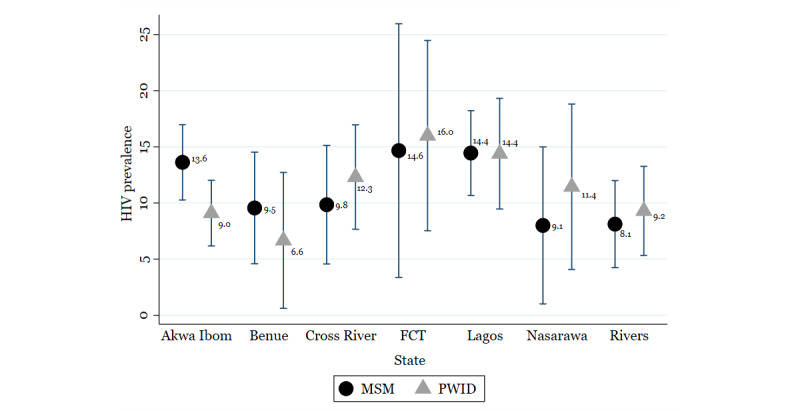
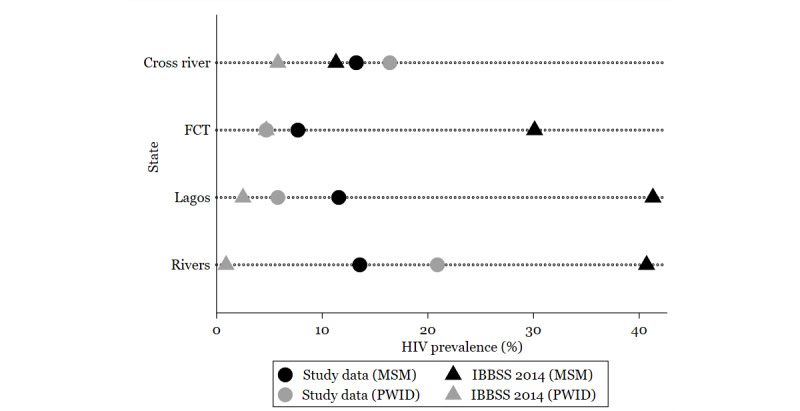
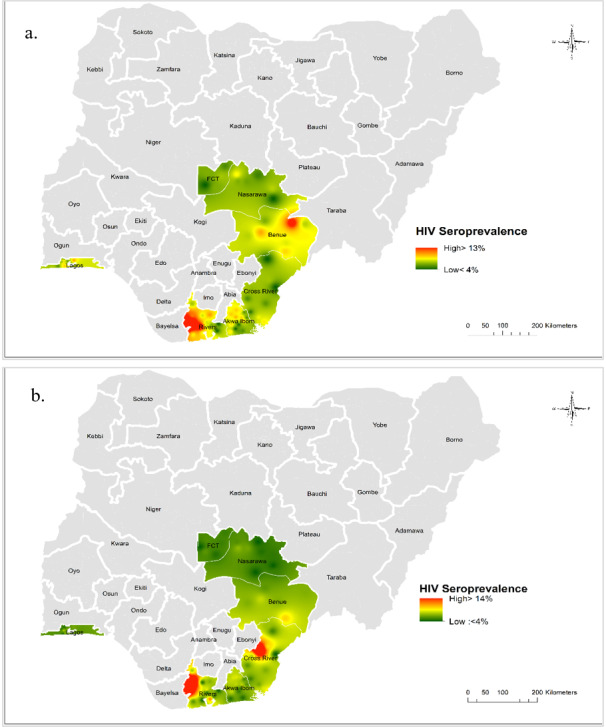
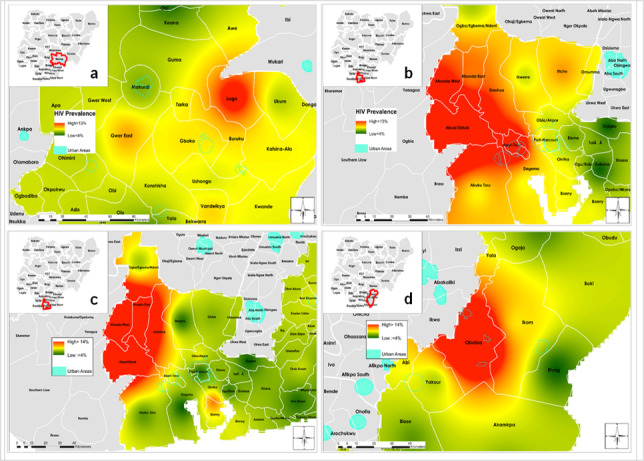
Results: MSM and PWID had HIV seroprevalence rates of 12.14% (3209/26,423) and 11.88% (1126/9474), respectively. Global spatial autocorrelation Moran I statistics revealed a clustered distribution of HIV infection among MSM and PWID with a <5% and <1% likelihood that this clustered pattern could be due to chance, respectively. Significant clusters of HIV infection (Getis-Ord-Gi* statistics) confined to the North Central and South South regions were identified among MSM and PWID. Compared to the 2014 integrated biological and behavioural surveillance survey, our results suggest an increased HIV seroprevalence among PWID and a substantial decrease among MSM.
Conclusions: This study identified geographical areas to prioritize for control of HIV infection among MSM and PWID, thus demonstrating that geographical information system technology is a useful tool to inform public health planning for interventions targeting epidemic control of HIV infection.
Keywords: Getis-Ord-Gi*; HIV seroprevalence; HIV testing modality; IBBSS; MSM; Nigeria; PWID; geospatial; hotspots; key population.
©Amobi Onovo, Abiye Kalaiwo, Moses Katbi, Otse Ogorry, Antoine Jaquet, Olivia Keiser. Originally published in JMIR Public Health and Surveillance (https://publichealth.jmir.org), 24.05.2021.
Conflict of interest statement
Conflicts of Interest: None declared.
Figures
References
-
- Tanser F, de Oliveira T, Maheu-Giroux M, Bärnighausen Till. Concentrated HIV subepidemics in generalized epidemic settings. Curr Opin HIV AIDS. 2014 Mar;9(2):115–25. doi: 10.1097/COH.0000000000000034. http://europepmc.org/abstract/MED/24356328 - DOI - PMC - PubMed
-
- Wand H, Ramjee G. Targeting the hotspots: investigating spatial and demographic variations in HIV infection in small communities in South Africa. J Int AIDS Soc. 2010 Oct 27;13:41. doi: 10.1186/1758-2652-13-41. https://jiasociety.biomedcentral.com/articles/10.1186/1758-2652-13-41 - DOI - PMC - PubMed
-
- Chimoyi LA, Musenge E. Spatial analysis of factors associated with HIV infection among young people in Uganda, 2011. BMC Public Health. 2014 Jun 05;14:555. doi: 10.1186/1471-2458-14-555. https://bmcpublichealth.biomedcentral.com/articles/10.1186/1471-2458-14-555 - DOI - PMC - PubMed
Publication types
MeSH terms
Substances
Grants and funding
LinkOut - more resources
Full Text Sources
Other Literature Sources
Medical
