. 2021 Aug 2;220(8):e202007061.
doi: 10.1083/jcb.202007061. Epub 2021 May 24.

The Rab7 effector WDR91 promotes autophagy-lysosome degradation in neurons by regulating lysosome fusion

Affiliations

The Rab7 effector WDR91 promotes autophagy-lysosome degradation in neurons by regulating lysosome fusion

Ruxiao Xing et al. J Cell Biol. .

Abstract

The effectors of the Rab7 small GTPase play multiple roles in Rab7-dependent endosome-lysosome and autophagy-lysosome pathways. However, it is largely unknown how distinct Rab7 effectors coordinate to maintain the homeostasis of late endosomes and lysosomes to ensure appropriate endolysosomal and autolysosomal degradation. Here we report that WDR91, a Rab7 effector required for early-to-late endosome conversion, is essential for lysosome function and homeostasis. Mice lacking Wdr91 specifically in the central nervous system exhibited behavioral defects and marked neuronal loss in the cerebral and cerebellar cortices. At the cellular level, WDR91 deficiency causes PtdIns3P-independent enlargement and dysfunction of lysosomes, leading to accumulation of autophagic cargoes in mouse neurons. WDR91 competes with the VPS41 subunit of the HOPS complex, another Rab7 effector, for binding to Rab7, thereby facilitating Rab7-dependent lysosome fusion in a controlled manner. WDR91 thus maintains an appropriate level of lysosome fusion to guard the normal function and survival of neurons.


Figures

Figure 1.
Figure 1.
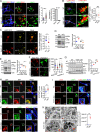
Loss of WDR91 leads to neuron degeneration.(A) Representative footprint images of WT and Wdr91 cKO mice at P21. Scale bars, 1 cm. The ratio of stride length to width from WT (n = 7) and Wdr91 cKO (n = 8) mice is shown on the right. Five to six steps were analyzed for each animal. (B) Duration on the rotating rod of WT (n = 7) and Wdr91 cKO (n = 9) mice at P21. (C) Representative images of WT and Wdr91 cKO mice at P21 in tail-suspension assays. (D) H&E staining of brain sections of WT and Wdr91 cKO mice at P21. The corpus callosum is outlined with black lines. Scale bars, 1,000 µm. (E) H&E staining of the corpus callosum in coronal sections of WT and Wdr91 cKO mice at P21. Blue arrows indicate eosinophilic spheroids. Scale bars, 20 µm. Quantification of ectopic eosinophilic spheroids (39 sections from three mice for each genotype) is shown on the right. (F) Representative TEM images of myelin in the brain of WT and Wdr91 cKO mice at P21. Scale bars, 0.5 µm. Quantification of myelin thickness (15 sections from three mice for each genotype) is shown on the right. (G) Representative TEM images of autolysosomes (blue arrowheads) in the brain of WT and Wdr91 cKO mice at P21. Scale bars, 0.5 µm. Quantification of the proportion of neurons containing autolysosomes (200 sections from three mice for each genotype) is shown on the right. (H) Representative images (left) and quantification (right) of AC3+ (green) staining of NeuN+ (red) neurons in coronal sections of cerebral cortex of WT and Wdr91 cKO mice at P21. AC3+ cells are indicated with arrows. Scale bars, 50 µm. 24 sections from three mice for each genotype were scored. (I) Representative images (left) and quantification (right) of staining of Calbindin (red) and MBP (green) in coronal sections of cerebral cortex of WT and Wdr91 cKO mice at P21. Scale bars, 200 µm. Boxed regions in the middle images are magnified and shown in the right images. Calbindin staining of Purkinje cells is indicated with arrows. Nuclei are stained with DAPI (blue). Scale bars, 100 µm. 30 sections from three mice for each genotype were analyzed. For all quantifications, error bars represent SEM. Data were from three independent experiments. **, P < 0.01; ***, P < 0.001.
Figure S1.
Figure S1.
Loss of WDR91 leads to neuron degeneration.(A) Immunostaining of MBP in Wdr91f/f, Wdr91f/f Nestin cre and Wdr91f/f Olig2 cre mice at P21. Scale bars, 1,000 µm. Boxed regions in each image are magnified on the bottom to show the corpus callosum. Scale bars, 100 µm. (B–D) Immunostaining (left) and quantification (right) of GFAP (B) and Iba1 (C) in the cerebral cortex and AC3 in cerebellum (D) of WT and Wdr91 cKO mice at P21. Scale bars, 50 µm in B and C; 20 µm in D. For all quantifications, ≥3 mice in each genotype were analyzed. Error bars represent SEM. Data were from three independent experiments. **, P < 0.01; ***, P < 0.001.
Figure 2.
Figure 2.
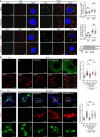
Loss of WDR91 causes lysosome defects.(A) Left: Immunostaining of LAMP1 (green), EEA1 (red), and the neuronal marker Map2 (blue) in cultured primary cortex neurons isolated from WT and Wdr91 cKO mice. Boxed regions are magnified and shown on the right. Organelles with strong LAMP1 staining are indicated with white arrowheads. EEA1-positive organelles with weak LAMP1 staining are indicated with yellow arrowheads. Scale bars, 5 µm. Middle: Quantification of lysosomal diameters (≥570 vesicles from 114 neurons for each genotype). Right: Quantification of enlarged lysosomes in the soma or axon of Wdr91−/− neurons. 117 enlarged LAMP1-organelles in 29 Wdr91−/− neurons were analyzed. (B) Left: Immunostaining of CTSD (green) and Map2 (blue) in cultured primary cortex neurons expressing LAMP1-RFP. Neurons were isolated from WT and Wdr91 cKO mice and transfected with the vector expressing LAMP1-RFP. Cells were immunostained and imaged 24 h after transfection. Scale bars, 10 µm. Boxed regions are magnified and shown on the right. White arrowheads indicate organelles that are double positive for LAMP1 and CTSD. Scale bars, 5 µm. The ratio of CTSD- and LAMP1-positive vesicles to total LAMP1-vesicles from ≥22 cells for each genotype is shown on the right. (C) LysoSensor staining in cultured primary cortex neurons (left). Cells were stained and imaged 24 h after transfection of the vector expressing LAMP1-RFP. Arrowheads indicate the enlarged lysosomes with weaker yellow fluorescence. Scale bars, 5 µm. The ratio of fluorescence intensity of LysoSensor to LAMP1-RFP from ≥45 cells for each genotype is shown on the right. (D and E) Immunoblotting analysis of CTSB (D) and CTSD (E) in brain homogenates of WT and Wdr91 cKO mice. Quantification of protein levels of three mice for each genotype are shown in the right panels. (F) Bodipy-Pepstatin A and Magic Red staining in cultured primary cortex neurons (left). Scale bars, 5 µm. White lines mark the border of the cells. Quantification of fluorescence intensity of ≥114 cells for each group is shown on the right. (G) Immunoblotting of LC3 and p62 in brain homogenates of WT and Wdr91 cKO mice (left). Quantification of protein levels is shown on the right. Three animals of each genotype were analyzed. (H) Representative images and quantification of RFP-GFP-LC3 in cultured primary cortex neurons isolated from WT and Wdr91 cKO mice (left). Cells were imaged 24 h after transfection of the vector expressing RFP-GFP-LC3. Scale bars, 10 µm. Boxed regions are magnified and shown on the bottom left in each image. Scale bars, 5 µm. The ratio of GFP+RFP+ puncta to total RFP+ puncta in ≥45 cells is quantified on the right. (I and J) Immunostaining of LC3B (red; I) and p62 (red; J) with LAMP1 (green) in cultured primary cortex neurons (stained with Map2 in blue). Scale bars, 10 µm. Boxed regions are magnified and shown on the bottom left in each image. Scale bars, 5 µm. (K) Representative TEM images of autophagosomes and autolysosomes (red arrowheads) in brain cortex of WT and Wdr91 cKO mice (left). Scale bars, 0.2 µm. The number of autophagosomes and autolysosomes is quantified on the right. 200 sections from three mice for each genotype were scored. For all quantifications, data were from three independent experiments. Error bars represent SEM. *, P < 0.05; **, P < 0.01; ***, P < 0.001.
Figure S2.
Figure S2.
Loss of WDR91 causes autophagic defects.(A and B) Coimmunostaining of ubiquitin with p62 (A) and LC3B with NeuN (B) in brain sections of WT and Wdr91 cKO mice. Nuclei are stained with DAPI (blue). Scale bars, 20 µm. Boxed regions are magnified in the rightmost columns (Zoom). Scale bars, 5 µm.
Figure 3.
Figure 3.
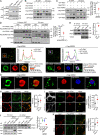
Loss of WDR91 enhances lysosome fusion.(A) Immunostaining of LAMP1 in control (Ctrl) and WDR91 knockout (KO-91) HeLa cells treated with PBS or AR for 25 min. Scale bars, 5 µm. (B) Time-lapse recording of lysosomal fusion in Ctrl and KO-91 HeLa cells. Cells expressing LAMP1-GFP were treated with AR for 25 min, then returned to normal culture. 0 min refers to the time point when AR was replaced with normal culture medium. Colored arrowheads indicate different vesicles that were followed for fusion. Scale bars, 3 µm. (C) Representative images and quantification of lysosomal diameters at the indicated time points after removal of AR. Scale bars, 5 µm. Quantification of the change in lysosome diameters is shown on the right. ≥180 lysosomes from 36 cells were analyzed for each time point. (D) Immunostaining of LAMP1 (green) and Map2 (red) in cultured primary cortex neurons isolated from WT and Wdr91 cKO mice (left). Nuclei are stained with DAPI (blue). Neurons were treated with AR for 25 min and then returned to normal culture for the indicated time. Scale bars, 2 µm. The boxed region is magnified at the bottom right in each image. Scale bars, 2 µm. Quantification of lysosomal size during recovery is shown on the right. ≥125 lysosomes from 25 cells were analyzed for each time point. (E) Time-lapse recording of lysosomal fusion in cultured primary cortex neurons isolated from WT and Wdr91 cKO mice. Cells expressing LAMP1-GFP were treated with AR for 25 min, then returned to normal culture. 0 min refers to the time point when AR was replaced with normal culture medium. Scale bars, 5 µm. The boxed regions of the cells in the left panels were selected for imaging. Time-lapse images are magnified and shown on the right. Scale bars, 1 µm. Colored arrowheads indicate different vesicles that were followed. (F) Representative images (left) and quantification (right) of lysosomal sizes in Ctrl and KO-91 HeLa cells at the indicated times after vacuolin-1 was added. ≥160 lysosomes from 32 cells were analyzed. Scale bars, 5 µm. (G) Time-lapse recording of lysosome dynamics in Ctrl and KO-91 HeLa cells treated with 2 µM vacuolin-1. Cells expressing LAMP1-GFP were treated with vacuolin-1 for 1 h, then returned to normal culture (time 0) and imaged. Colored arrowheads indicate different vesicles that were followed. Scale bars, 3 µm. (H) Representative images (left) and quantification (right) of lysosomal sizes in Ctrl and KO-91 HeLa cells 6 or 18 h following removal of vacuolin-1. ≥225 lysosomes from 45 cells were analyzed. Scale bars, 5 µm. For all quantifications, error bars represent SEM. Data were from three independent experiments. *, P < 0.05; ***, P < 0.001.
Figure S3.
Figure S3.
Time-lapse recording of lysosomal fragmentation and tubulation in LAMP1-GFP-expressing Ctrl and KO-91 HeLa cells treated with AR. 10 min refers to the time point when AR was added. Colored arrowheads indicate different tubulation events that were followed. Scale bars, 3 µm.
Figure 4.
Figure 4.
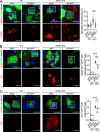
Regulation of lysosomal size by WDR91 depends on its interaction with Rab7.(A) Coimmunostaining of EEA1 with LAMP1 or Rab7 in Ctrl and KO-91 HeLa cells treated without or with VPS34-IN1 (2 µM) for 3 h (left and middle). Scale bars, 5 µm. Quantification of diameters of LAMP1-positive (top right) and Rab7-positive (middle right) organelles in Ctrl and KO-91 cells is shown on the right. ≥125 lysosomes from 25 cells were analyzed for each group. Immunoblotting of EEA1 protein levels is shown on the bottom right. (B) Coimmunostaining of LAMP1 with WT and mutant WDR91 tagged with Flag in KO-91 HeLa cells (left and middle). Scale bars, 5 µm. Quantification of diameters of LAMP1-positive organelles in KO-91 cells is shown on the right. ≥125 lysosomes from 25 cells were analyzed for each group. (C) Coimmunostaining of LAMP1 (green) and Map2 (blue) with WT and mutant WDR91 tagged with Flag (red) in cultured primary cortex neurons isolated from Wdr91 cKO mice (left and middle). Scale bars, 20 µm. Boxed regions in the top row are magnified to show WDR91 (middle) and LAMP1 (bottom) staining. Scale bars, 5 µm. Quantification of diameters of LAMP1-positive organelles is shown on the right. ≥125 lysosomes from 25 cells were analyzed for each group. For all quantifications, error bars represent SEM. Data were from three independent experiments. ***, P < 0.001.
Figure 5.
Figure 5.
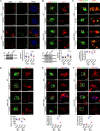
WDR91 competes with VPS41 for binding to Rab7.(A) CoIP of GFP-WDR91 with Flag-VPS41 and Flag-VPS39. IP was performed with Flag antibody and detected with Flag and GFP antibodies. (B) CoIP of GFP-Rab7 with Flag-VPS39 and/or mCh-WDR91. IP was performed with GFP antibody and detected with antibodies against GFP, Flag, and mCherry. (C) CoIP of GFP-Rab7 with Flag-VPS41 and/or mCh-WDR91. IP was performed with GFP antibody and detected with antibodies against GFP, Flag, and mCherry. The relative efficiency of coIP of Flag-VPS41 with GFP-Rab7 is quantified and shown on the right. (D) Purified GST and GST-Rab7 immobilized on glutathione-Sepharose beads were incubated with purified His-VPS41(1–450), Flag-WDR91(392–747), or both. The precipitated proteins were detected with antibodies against Flag, His, and GST (left). Relative His-VPS41(1–450) pull-down efficiency by GST-Rab7 is quantified and shown in the right panel. (E) CoIP of endogenous Rab7 with VPS41 in Ctrl or KO-91 HeLa cells. IP was performed with VPS41 antibody and detected with antibodies against the indicated proteins. Quantification of coIP efficiency is shown on the right. (F) Analysis of vesicular colocalization of GFP-VPS41 with mCh-Rab7 in the absence or presence of Flag-WDR91 in KO-91 HeLa cells. Scale bars, 2 µm. Boxed regions are magnified and shown on the right. Fluorescence intensities of mCh-Rab7 (red curve), GFP-VPS41 (green curve), and Flag-WDR91 (blue curve) were measured along the dashed line across the vesicle. Scale bars, 1 µm. Quantification of the percentage of vesicles with overlapping mCh-Rab7 and GFP-VPS41 signals. 165 vesicles were examined in >30 cells for each group. (G) Representative 3D reconstruction images of vesicular mCh-Rab7 and GFP-VPS41 without or with Flag-WDR91 in KO-91 HeLa cells. Scale bars, 2 µm. (H and I) Representative images of the colocalization of LAMP1 with GFP-VPS41 (H) or Flag-VPS41 (I) in Ctrl and KO-91 HeLa cells (H) or in cultured primary cortex neurons isolated from WT and Wdr91 cKO mice (I). Scale bars, 5 µm. Quantification of Pearson’s correlation coefficient is shown in the right panels. ≥30 cells were analyzed. (J) CoIP of endogenous VPS18 with VPS41 in Ctrl or KO-91 HeLa cells. IP was performed with VPS41 antibody and detected with antibodies against the indicated proteins. Quantification of coIP efficiency is shown on the right. (K) Representative images of the colocalization of Rab7 with Flag-VPS18 in Ctrl and KO-91 HeLa cells. Scale bars, 5 µm. Quantification of Pearson’s correlation coefficient is shown on the right panel. ≥30 cells were analyzed for each group. For all quantifications, error bars represent SEM. Data were from three independent experiments. *, P < 0.05; **, P < 0.01; ***, P < 0.001.
Figure S4.
Figure S4.
VPS41 interacts with Rab7 through the WD40 repeats.(A) Schematic representation of the protein domains of WDR91 and VPS41. CC, coiled-coil domain; LC, low complexity; WD40, WD40-repeat containing domain; TPR, tetratricopeptide repeat-like domain; CHCR, clathrin heavy chain repeat; R, RING-H2 zinc finger domain. (B) CoIP of GFP-Rab7 with Flag-VPS41 truncations. IP was performed with Flag antibody and detected with antibodies against Flag and GFP. To stabilize the expression of Flag-VPS41451–855, cells were treated with MG-132 (0.2 µM) for 24 h. (C) Colocalization of GFP-Rab7 with Flag-VPS41 truncations in HeLa cells. To stabilize the expression of Flag-VPS41451–855, cells were treated with MG-132 (0.2 µM) for 24 h. Scale bars, 5 µm. Boxed areas are enlarged in the panels labeled Zoom. Scale bars, 2 µm. (D) 3D reconstruction of the colocalization of GFP-VPS41 and mCh-Rab7 on lysosomes in the absence or presence of Flag-WDR91 in KO-91 HeLa cells, using Imaris software. Scale bars, 2 µm.
Figure S5.
Figure S5.
Inactivation of VPS41 rescues excessive lysosomal fusion caused by WDR91 deficiency.(A) Immunostaining of LAMP1 (red) and EEA1 (green) in Ctrl or KO-91 HeLa cells expressing negative control siRNA (siNC) or VPS41 siRNA (siVPS41). Cells were treated with AR for 25 min and then returned to normal culture for the indicated time (left). Scale bars, 5 µm. Relative change in the size of lysosomes (LAMP1+/EEA1) is quantified and shown on the right. (B) Immunostaining of LAMP1 (left) and quantification of lysosome sizes (middle) in Ctrl and KO-91 HeLa cells treated with negative control siRNA (siNC), VPS18 siRNA (siVPS18), or VPS39 siRNA (siVPS39) for 72 h. Scale bars, 5 µm. The mRNA levels of VPS18 and VPS39 detected by qPCR in HeLa cells treated with siNC, siVPS18, or siVPS39 are shown on the right. (C) Determining the specificity and efficiency of Vps41 shRNA. N2a cells were transfected with plasmids expressing shVps41, and 72 h after transfection, mRNA levels of indicated genes were examined by qPCR. (D) Left: Immunostaining of LAMP1 (red) in primary neurons expressing negative control shRNA (shNC) or Vps41 shRNA (shVps41). GFP was used as the transfection marker. Neurons were treated with AR for 25 min, and then returned to normal culture for the indicated time (left). Scale bars, 5 µm. Relative lysosomal size change is quantified and shown on the right. (E) Schematic diagram of the stereotaxic injection of lentivirus coexpressing GFP and shNC or shVps41. For all quantifications, ≥30 cells were analyzed for each treatment. Error bars represent SEM. Data were from three independent experiments. *, P < 0.05; ***, P < 0.001.
Figure 6.
Figure 6.
VPS41 knockdown ameliorates the lysosomal and autophagic defects caused by WDR91 deficiency.(A) Immunostaining of LAMP1 and EEA1 (top) and quantification of lysosome (EEA-1/LAMP1+) sizes (bottom right) in Ctrl and KO-91 HeLa cells treated with negative control siRNA (siNC) or VPS41 siRNA (siVPS41) for 72 h. Scale bars, 5 µm. ≥125 lysosomes from 25 cells were analyzed for each group. Immunoblotting of VPS41 in HeLa cells treated with siNC and siVPS41 for 72 h is shown on the bottom left. (B) Representative images (top) and quantification of lysosome size (bottom right) in WT or Wdr91 cKO primary neurons coexpressing LAMP1-RFP with negative control shRNA (shNC) or Vps41 shRNA (shVps41). GFP was used as transfection marker. Scale bars, 10 µm. Boxed regions in the left column are magnified on the right to show LAMP1 staining. Scale bars, 5 µm. ≥150 lysosomes from 25 cells were analyzed for each group. Immunoblotting of VPS41 and VPS18 in N2a cells treated with shNC or shVps41 for 72 h is shown on the bottom left. (C) LysoSensor staining in WT and Wdr91 cKO primary neurons coexpressing LAMP1-RFP with shNC or shVps41 (left). GFP was used as transfection marker. Scale bars, 10 µm. Boxed regions in the left column are magnified on the right to show LAMP1 (red) and LysoSensor (yellow) staining. Scale bars, 5 µm. The ratio of LysoSensor-stained lysosomes to total lysosomes in a cell is quantified and shown on the bottom. ≥22 cells were analyzed for each group. (D–F) Staining of Magic Red (D), p62 with LAMP1 (E), and LC3 with LAMP1 (F) in WT or Wdr91 cKO primary neurons treated with shNC or shVps41. GFP was used as transfection marker. Scale bars, 10 µm. In each panel, boxed regions in the left column are magnified on the right to show staining of indicated proteins. Scale bars, 5 µm. Indicated quantifications are shown on the bottom. In D, ≥35 cells were analyzed for each group. In E and F, ≥48 cells were analyzed for each group. For all quantifications, error bars represent SEM. Data were from three independent experiments. *, P < 0.05; **, P < 0.01; ***, P < 0.001.
Figure 7.
Figure 7.
VPS41 knockdown rescues the neuron degeneration in Wdr91 cKO mice.(A) Staining of LAMP1 (red) and NeuN (blue) in brain cortex of WT or Wdr91 cKO mice injected with lentivirus coexpressing GFP and Vps41 shRNA or control shRNA constructs. Scale bars, 10 µm. Boxed regions are magnified on the bottom to show LAMP1 staining. Scale bars, 2 µm. Quantification of diameters of LAMP1-positive organelles is shown on the right. ≥120 lysosomes from 24 cells from three mice were analyzed for each group. (B) Staining of p62 (red) and NeuN (blue) in brain cortex of WT or Wdr91 cKO mice injected with lentivirus coexpressing GFP and Vps41 shRNA or control shRNA constructs. Scale bars, 10 µm. Boxed regions are magnified on the bottom to show p62 staining. Scale bars, 2 µm. Quantification of p62-positive cells is shown on the right. ≥48 cells were analyzed for each group. (C) Staining of AC3 (red) and NeuN (blue) in brain cortex of WT or Wdr91 cKO mice injected with lentivirus coexpressing GFP and Vps41 shRNA or control shRNA constructs. Scale bars, 10 µm. Boxed regions are magnified on the bottom to show AC3 staining. Scale bars, 2 µm. Quantification of AC3-positive cells is shown on the right. ≥59 cells were analyzed for each group. For all quantifications, error bars represent SEM. Data were from three independent experiments. **, P < 0.01; ***, P < 0.001.

Similar articles

Cited by

References

    1. Balderhaar, H.J.K., and Ungermann C.. 2013. CORVET and HOPS tethering complexes - coordinators of endosome and lysosome fusion. J. Cell Sci. 126:1307–1316. 10.1242/jcs.107805 - DOI - PubMed
    1. Balderhaar, H.J.K., Arlt H., Ostrowicz C., Bröcker C., Sündermann F., Brandt R., Babst M., and Ungermann C.. 2010. The Rab GTPase Ypt7 is linked to retromer-mediated receptor recycling and fusion at the yeast late endosome. J. Cell Sci. 123:4085–4094. 10.1242/jcs.071977 - DOI - PubMed
    1. Ballabio, A., and Bonifacino J.S.. 2020. Lysosomes as dynamic regulators of cell and organismal homeostasis. Nat. Rev. Mol. Cell Biol. 21:101–118. 10.1038/s41580-019-0185-4 - DOI - PubMed
    1. Bröcker, C., Kuhlee A., Gatsogiannis C., Balderhaar H.J.K., Hönscher C., Engelbrecht-Vandré S., Ungermann C., and Raunser S.. 2012. Molecular architecture of the multisubunit homotypic fusion and vacuole protein sorting (HOPS) tethering complex. Proc. Natl. Acad. Sci. USA. 109:1991–1996. 10.1073/pnas.1117797109 - DOI - PMC - PubMed
    1. Cai, Q., Lu L., Tian J.H., Zhu Y.B., Qiao H., and Sheng Z.H.. 2010. Snapin-regulated late endosomal transport is critical for efficient autophagy-lysosomal function in neurons. Neuron. 68:73–86. 10.1016/j.neuron.2010.09.022 - DOI - PMC - PubMed

Publication types

MeSH terms

Substances