. 2021 Sep 4;144(8):2499-2512.
doi: 10.1093/brain/awab207.

Common molecular mechanisms of SLC6A1 variant-mediated neurodevelopmental disorders in astrocytes and neurons

Affiliations

Common molecular mechanisms of SLC6A1 variant-mediated neurodevelopmental disorders in astrocytes and neurons

Felicia Mermer et al. Brain. .

Abstract

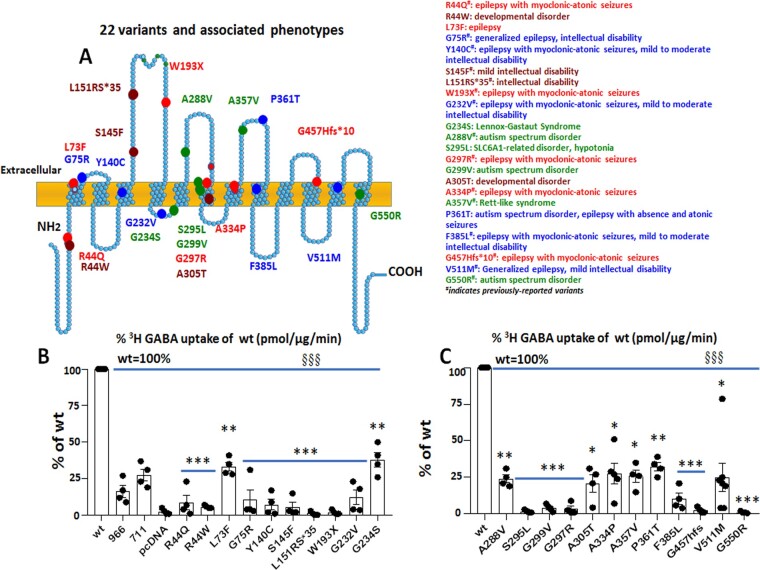
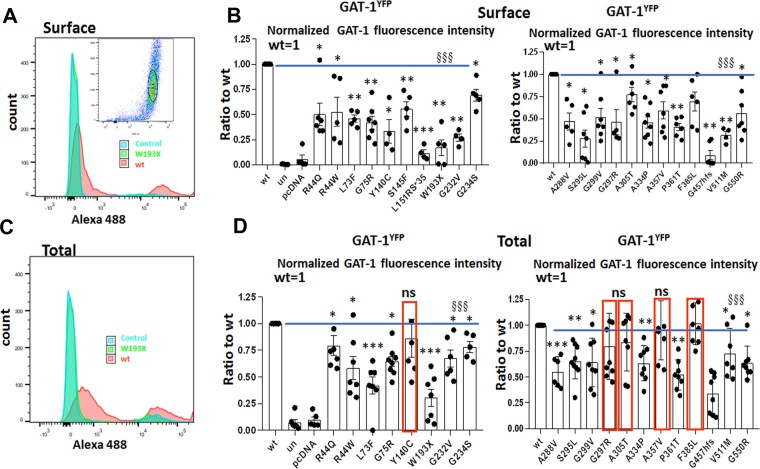
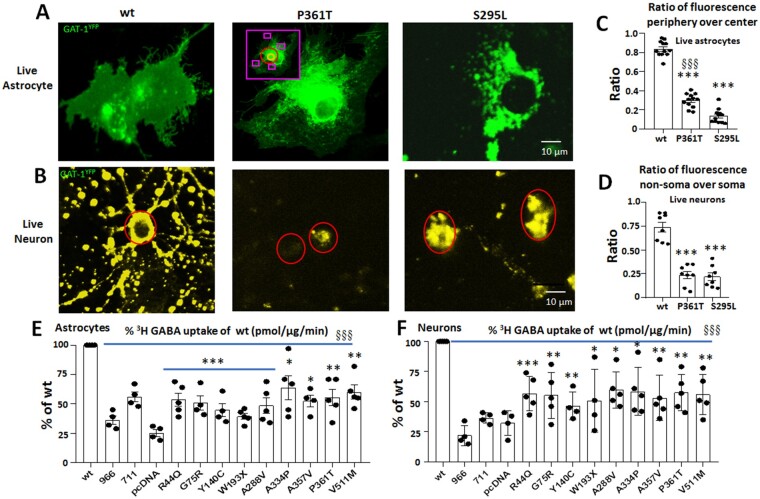
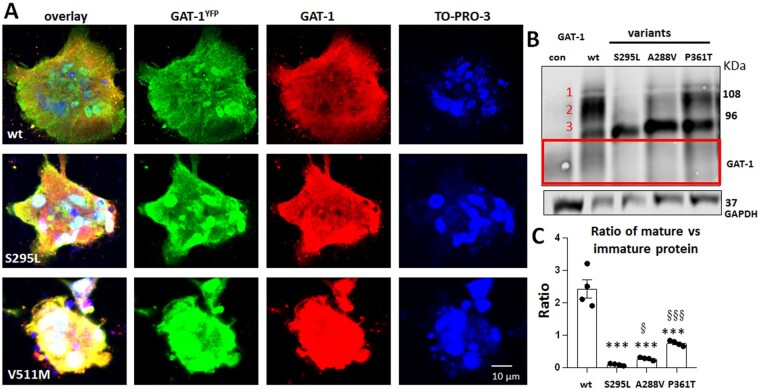
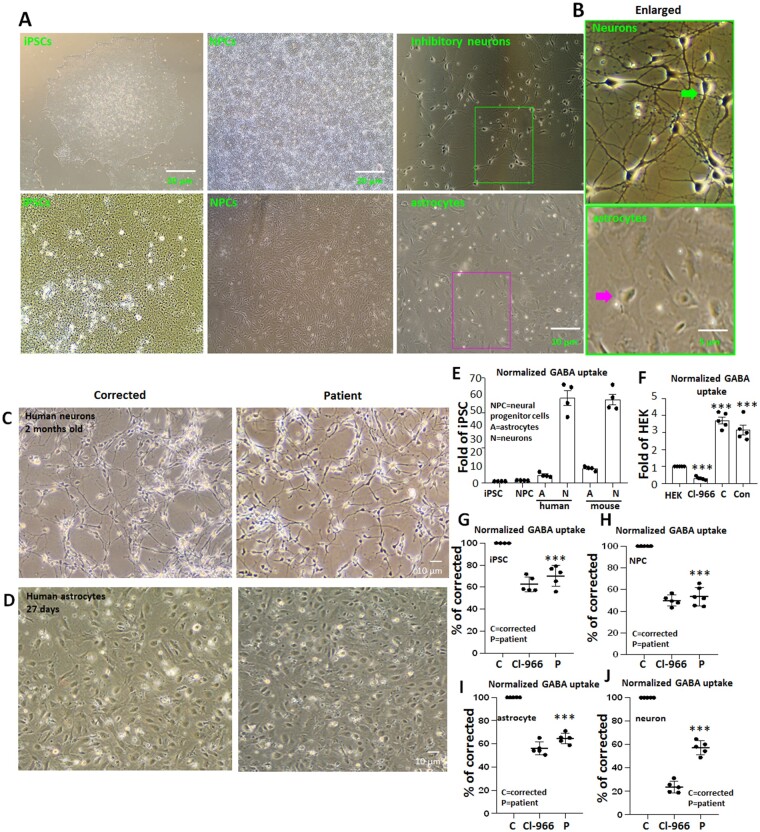
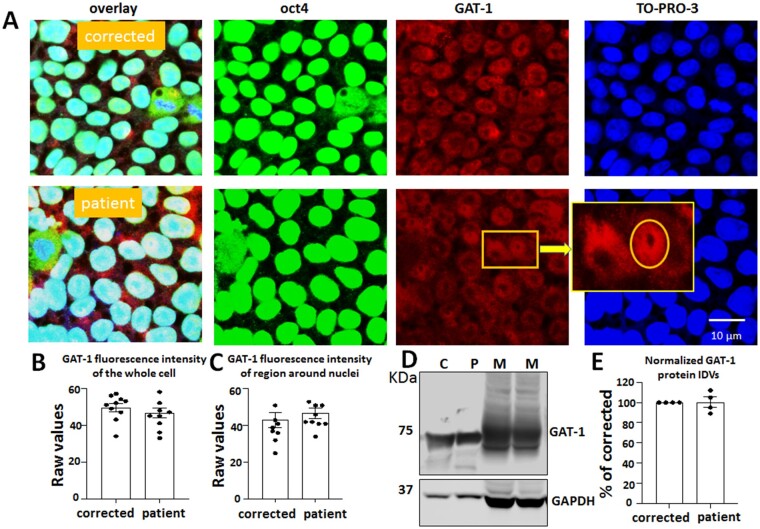
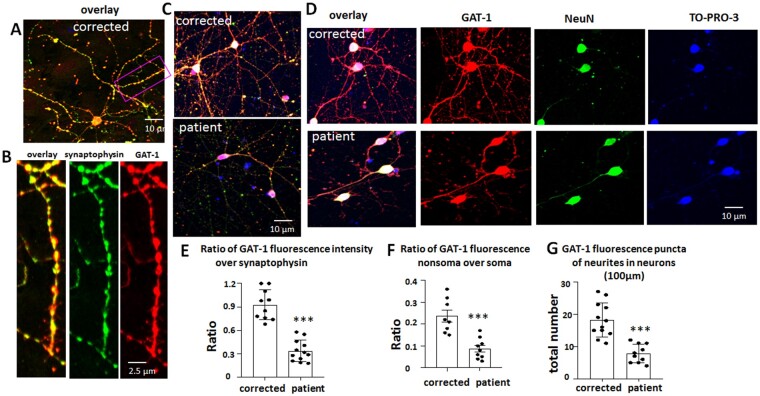
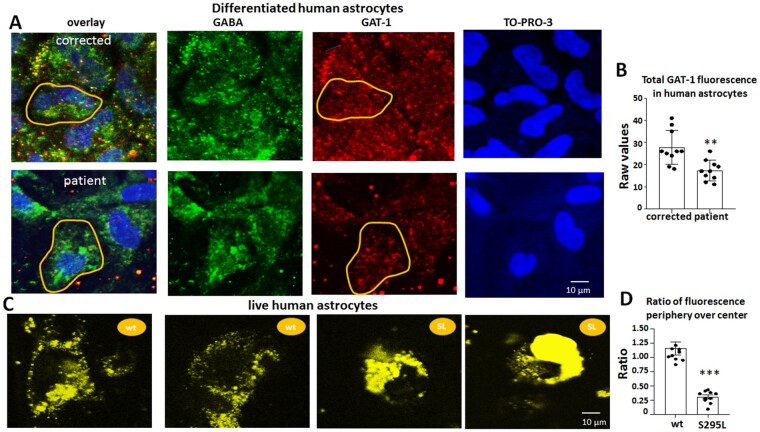
Solute carrier family 6 member 1 (SLC6A1) is abundantly expressed in the developing brain even before the CNS is formed. Its encoded GABA transporter 1 (GAT-1) is responsible for the reuptake of GABA into presynaptic neurons and glia, thereby modulating neurotransmission. GAT-1 is expressed globally in the brain, in both astrocytes and neurons. The GABA uptake function of GAT-1 in neurons cannot be compensated for by other GABA transporters, while the function in glia can be partially replaced by GABA transporter 3. Recently, many variants in SLC6A1 have been associated with a spectrum of epilepsy syndromes and neurodevelopmental disorders, including myoclonic atonic epilepsy, childhood absence epilepsy, autism, and intellectual disability, but the pathomechanisms associated with these phenotypes remain unclear. The presence of GAT-1 in both neurons and astrocytes further obscures the role of abnormal GAT-1 in the heterogeneous disease phenotype manifestations. Here we examine the impact on transporter trafficking and function of 22 SLC6A1 variants identified in patients with a broad spectrum of phenotypes. We also evaluate changes in protein expression and subcellular localization of the variant GAT-1 in various cell types, including neurons and astrocytes derived from human patient induced pluripotent stem cells. We found that a partial or complete loss-of-function represents a common disease mechanism, although the extent of GABA uptake reduction is variable. The reduced GABA uptake appears to be due to reduced cell surface expression of the variant transporter caused by variant protein misfolding, endoplasmic reticulum retention, and subsequent degradation. Although the extent of reduction of the total protein, surface protein, and the GABA uptake level of the variant transporters is variable, the loss of GABA uptake function and endoplasmic reticulum retention is consistent across induced pluripotent stem cell-derived cell types, including astrocytes and neurons, for the surveyed variants. Interestingly, we did not find a clear correlation of GABA uptake function and the disease phenotypes, such as myoclonic atonic epilepsy versus developmental delay, in this study. Together, our study suggests that impaired transporter protein trafficking and surface expression are the major disease-associated mechanisms associated with pathogenic SLC6A1 variants. Our results resemble findings from pathogenic variants in other genes affecting the GABA pathway, such as GABAA receptors. This study provides critical insight into therapeutic developments for SLC6A1 variant-mediated disorders and implicates that boosting transporter function by either genetic or pharmacological approaches would be beneficial.

Keywords: ER retention; GABA transporter 1 (GAT-1); SLC6A1; autism; epilepsy.


Figures

Figure 1
Figure 1
Partial or complete loss of GABA reuptake activity is a common phenomenon across GABA transporter 1 (encoded by SLC6A1) variations associated with a wide spectrum of epilepsy syndromes and neurodevelopmental disorders. (A) Schematic presentation of variant GABA transporter 1 (GAT-1) protein topology and locations of variations in human SLC6A1 associated with various epilepsy syndromes and neurodevelopmental disorders. These variations are distributed in various locations and domains of the encoded GAT-1 protein peptide. The coloured dots represent the relative locations of the disease-related variations. #Previously reported variants. (B and C) HEK293T cells were transfected with the empty vector pcDNA, wild-type, or the variant GAT-1YFP for 48 h. The graphs represent the altered GABA reuptake function of the variant GAT-1 encoded by 22 different SLC6A1 variations in HEK293T cells measured by the high-throughput 3H radiolabelling GABA uptake on a liquid scintillator with QuantaSmart. ‘966’ indicates the wild-type treated with GAT-1 inhibitor Cl-966 (50 µM), and ‘NNC-711’ indicates the wild-type treated with NNC-711 (70 µM) for 30 min before preincubation. n = 4 different transfections, §§§P < 0.001 overall variations versus wild-type, *P < 0.05, **P < 0.01, ***P < 0.001 versus wild-type, one-way ANOVA and Newman-Keuls test. Values are expressed as mean ± SEM.
Figure 2
Figure 2
Altered surface and total expression of variant GAT-1 measured with a high-throughput flow cytometry. (A and C) The flow cytometry histograms depict surface (A) or total (C) expression of the wild-type and the variant GAT-1. HEK293T cells were transfected with the wild-type or the variant GAT-1YFP using 3 µg of cDNAs with polyethylenimine (PEI) at a ratio of 1 µg cDNA to 2.5 µl PEI, with 3 µg cDNAs total. (B and D) The graphs showing the normalized cell surface (B) or total (D) expression of GAT-1YFP from the cells expressing the wild-type or the variant transporters. The relative subunit expression level of GAT-1 in each variant transporter, as well as untransfected (only with PEI) and mock transfected (pcDNA), was normalized to that obtained from cells with transfection of the wild-type. In D, red boxed variants were not different from the wild-type. n = 4–7 different transfections, §§§P < 0.001 overall variations versus wild-type, *P < 0.05, **P < 0.01, ***P < 0.001 versus wild-type, one-way ANOVA and Newman-Keuls test. Values are expressed as mean ± SEM.
Figure 3
Figure 3
Reduced function of variant GAT-1 in live mouse cortical astrocytes and neurons. Mouse cortical neurons were cultured from postnatal Day 0 pups, while cortical astrocytes were cultured from postnatal Day 0–3 pups. (A) Astrocytes (passage 2) were transfected with the wild-type GAT-1YFP, GAT-1(P361T)YFP or GAT-1(S295L)YFP with PEI and harvested at 48 h after transfection. (B) Neurons were transfected for the same conditions at Day 5–7 in culture with a calcium precipitation method and harvested for experiments at Day 15 in dish. The images show two representative variants (P361T) and (S295L) in live astrocytes (A) or in live neurons (B). (C and D) The GAT-1YFP fluorescence in different subcellular compartments was quantified by MetaMorph®. (C) The GAT-1YFP fluorescence in astrocytes was measured at the peripheral and central regions, as illustrated in the inset in the middle panel of A. The purple rectangle represents the peripheral region, the red circle represents the middle region, and the orange circle represents nuclei region, which was taken as background signal (n = 12 cells from four batches of cells). (D) The ratio of GAT-1YFP fluorescence in dendrites versus soma was measured by sampling the region of somatic versus non-somatic region (n = 8 fields from three batches of cells). (E and F) Neurons or astrocytes were prepared in 35 mm dishes, and the GABA uptake function was evaluated with 3H radiolabelling. The graph represents the relative activity of GABA uptake in mouse cortical astrocytes (E) or cortical neurons (F). In CF, ***P < 0.001 versus wild-type, in C, §§§P < 0.001 versus S295L. In E and F, n = 4–5 transfections, §§§P < 0.001 overall variants versus wild-type, *P < 0.05, **P < 0.01. One-way ANOVA and Newman-Keuls test was used to determine significance compared to the wild-type condition and between variations. Values are expressed as mean ± SEM.
Figure 4
Figure 4
Variant GAT-1 is accumulated inside astrocytes and is immature due to glycosylation arrest. (A) Representative images of mouse cortical astrocytes expressing the wild-type or the variant GAT-1YFP (S295L and V511M) for 48 h. The astrocytes were immunostained with a mouse monoclonal anti-GFP antibody, which recognizes GAT-1YFP, and rabbit polyclonal GAT-1 antibody, which recognizes the transfected and endogenous GAT-1. Cell nuclei were stained with TO-PRO-3 (four batches of cultures with transfections). (B) The total lysates of astrocytes expressing the wild-type or variant GAT-1 were analysed by SDS-PAGE. The membrane was immunoblotted with a rabbit anti-GAT-1, which detects both the transfected and endogenous GAT-1 expressed in astrocytes. The red-boxed region represents the endogenous GAT-1 in astrocytes. (C) The graph represents the ratio of normalized integrated protein density values (IDVs) of the bands with higher molecular mass (Bands 1 and 2) over the lower band (Band 3). ***P < 0.001 versus wild-type; §P < 0.05 and §§§P < 0.001 versus S295L. One-way ANOVA and Newman-Keuls test was used to determine the significance compared to the wild-type condition and between variants. Values are expressed as mean ± SEM.
Figure 5
Figure 5
Altered GABA uptake function in patient iPSCs derived from astrocytes and neurons. (A and B) Representative images of live iPSCs and derived NPCs, astrocytes, and inhibitory neurons (A). The boxed areas in A are enlarged in B, with arrows indicating typical inhibitory neuron or astrocyte morphology. (C and D) Images of neurons or astrocytes from corrected and patient cells before GABA uptake assay. Neurons were differentiated for 60–65 days, whereas the astrocytes were differentiated for 25–30 days from NPC (P1). (E) The relative GABA uptake level of iPSCs, NPCs, astrocytes and neurons differentiated from human iPSCs or cultured from mouse cortices. (F) The relative GABA uptake level of HEK293T cells and iPSCs, where C = corrected; Con = normal control human iPSCs; Cl-966 = HEK293T cells treated with Cl-966 (50 µM) for 30 min. (GJ) The plots represent the reduced GABA reuptake function from patient-derived iPSCs, iPSC-derived NPCs, astrocytes and neurons measured by the high-throughput 3H radiolabelling GABA uptake on a liquid scintillator with QuantaSmart™. For iPSCs, n = 5 different passages. For NPCs, astrocytes and neurons, n = 5 experiments, with cells prepared from three different batches of cells after differentiations. NPCs were evaluated at Day 5 of P2. Astrocytes were evaluated at Day 25–30 after differentiation, and neurons were evaluated 60–65 days after differentiation. Cl-966 (100 µM) was applied 30 min before preincubation. ***P < 0.001 versus corrected, one-way ANOVA and Newman-Keuls test. Values are expressed as mean ± SEM.
Figure 6
Figure 6
GAT-1 was expressed in patient-derived iPSCs. (A) The iPSCs, including the patient line [from a patient carrying the SLC6A1(S295L) variation] and the CRISPR corrected line (Corrected), were directly grown on Matrigel® coated glass-bottomed dishes for 2 days before staining with Oct4 (a marker for iPSCs) (mouse, 1:200) and GAT-1 (rabbit, 1:100) overnight at 4°C. Mouse IgG was visualized with Alexa-488 and rabbit IgG with Cy3. Cell nuclei were stained with TO-PRO-3 at 1:500 for 30 min. Representative images were obtained with confocal microscopy under objective 63× with zoom <2.5. The enlarged image in the insert shows the subcellular localization of GAT-1. (B) The fluorescence intensity of GAT-1 in the whole cell (B) or around the cell nuclei (C) was measured. (D and E) The total lysates of iPSCs or 3-month-old mouse brains were analysed by SDS-PAGE. The membrane was immunoblotted with GAT-1. C = corrected; M = mouse; P = patient. Graph represents normalized protein integrated density values (IDVs). In E, n = 4 blots. Values are expressed as mean ± SEM.
Figure 7
Figure 7
Variant GAT-1(S295L) was retained in neuronal soma with reduced expression in dendrites. (AD) GABAergic inhibitory neurons (aged 60–65 days) differentiated from CRISPR corrected and patient iPSCs were immunostained with rabbit polyclonal anti-GAT-1 antibody and mouse monoclonal anti-synaptophysin (AC) or anti-NeuN antibody (D). In B, the boxed region from A is enlarged for better synaptic visualization. The rabbit IgG was visualized with Cy3 (red) and the mouse IgG was visualized with Alexa-488 (green). The cell nuclei were stained with TO-PRO-3 (1:500). (E) The raw fluorescence values of GAT-1 and synaptophysin in non-somatic region were measured and the ratio was plotted. (F) The raw GAT-1 fluorescence values in non-somatic region and somatic regions were measured and the ratio was plotted. The soma was identified by neuronal marker NeuN. (G) GAT-1 fluorescence puncta in neurons differentiated from the CRISPR corrected and the patient iPSCs were quantified. The total fluorescent puncta per 100 µm was measured. In EG, n =8–12 from four batches of differentiated cells. In E and F, average raw fluorescence of GAT-1 or synaptophysin from three non-selectively chosen areas in non-somatic region was measured for each neuron. The mean value was taken as n =1. ***P <0.001 versus corrected, one-way ANOVA and Newman-Keuls test. Values are expressed as mean ± SEM.
Figure 8
Figure 8
GAT-1 protein expression was reduced in human astrocytes at low abundance but retained inside the endoplasmic reticulum at a higher abundance. (A). Human astrocytes (27–30 days old) differentiated from CRISPR corrected and patient iPSCs were immunostained with rabbit polyclonal anti-GAT-1 antibody and mouse monoclonal anti-GABA antibody. The rabbit IgG was visualized with Cy3 (red), while the mouse IgG was visualized with Alexa-488 (green). The cell nuclei were stained with TO-PRO-3. The yellow circled area was arbitrarily taken as one cell and the fluorescence in the circled area was measured. (B) The average raw fluorescence values of GAT-1 per cell as illustrated in yellow circled area in A were measured. (C) Live human astrocytes (27–30 days old) expressing the wild-type GAT-1YFP or the GAT-1(S295L)YFP were visualized under confocal microscopy under objective 63×. (D) The GAT-1YFP fluorescence in astrocytes was measured at periphery and central region as illustrated in Fig. 3A. The ratio of GAT-1YFP fluorescence at the periphery versus centre was measured. In B and D, **P <0.01, ***P <0.001 versus wild-type, unpaired t-test. n =10 from four batches of differentiated cells. Values are expressed as mean ± SEM.

Comment in

Similar articles

Cited by

References

    1. Ben-Ari Y.Excitatory actions of gaba during development: the nature of the nurture. Nat Rev Neurosci. 2002;3(9):728–739. - PubMed
    1. Andang M, Hjerling-Leffler J, Moliner A, et al.Histone H2AX-dependent GABA(A) receptor regulation of stem cell proliferation. Nature. 2008;451(7177):460–464. - PubMed
    1. Ge S, Pradhan DA, Ming GL, Song H.. GABA sets the tempo for activity-dependent adult neurogenesis. Trends Neurosci. 2007;30(1):1–8. - PubMed
    1. Loo DD, Eskandari S, Boorer KJ, Sarkar HK, Wright EM.. Role of Cl- in electrogenic Na+-coupled cotransporters GAT1 and SGLT1. J Biol Chem. 2000;275(48):37414–37422. - PubMed
    1. Sacher A, Nelson N, Ogi JT, Wright EM, Loo DD, Eskandari S.. Presteady-state and steady-state kinetics and turnover rate of the mouse gamma-aminobutyric acid transporter (mGAT3). J Membr Biol. 2002;190(1):57–73. - PubMed

Publication types

MeSH terms

Substances