. 2021 Jul 28;72(15):5508-5521.
doi: 10.1093/jxb/erab233.

Tyrosylprotein sulfotransferase-dependent and -independent regulation of root development and signaling by PSK LRR receptor kinases in Arabidopsis

Affiliations

Tyrosylprotein sulfotransferase-dependent and -independent regulation of root development and signaling by PSK LRR receptor kinases in Arabidopsis

Christine Kaufmann et al. J Exp Bot. .

Abstract

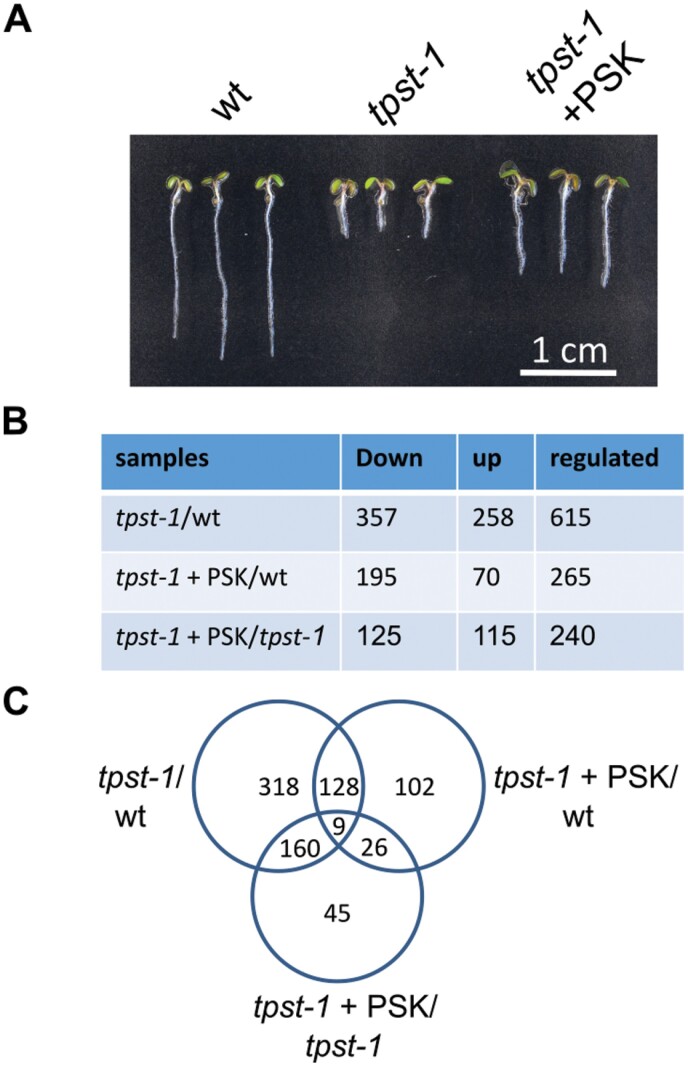
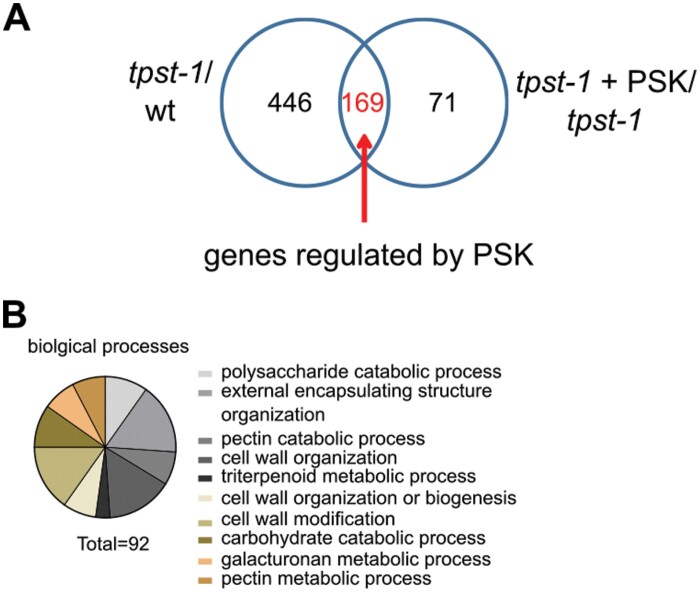
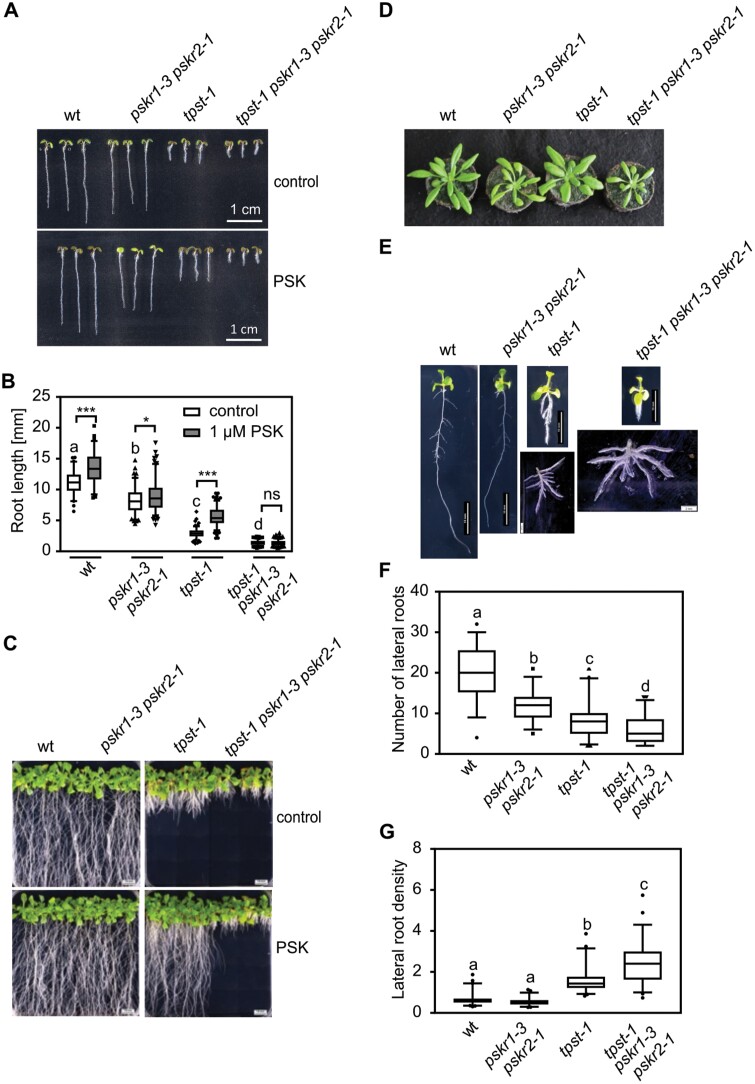
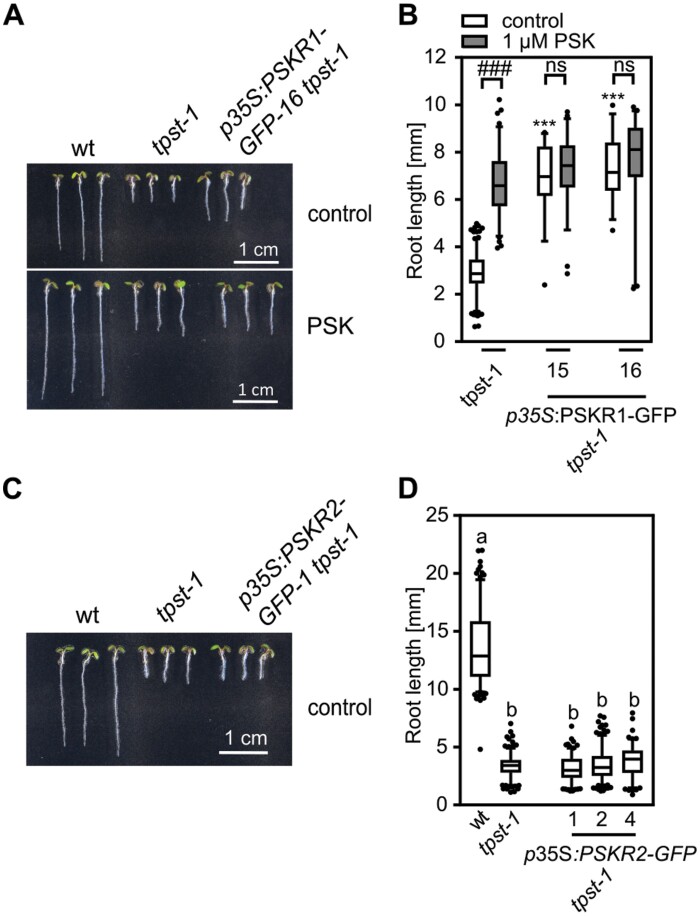
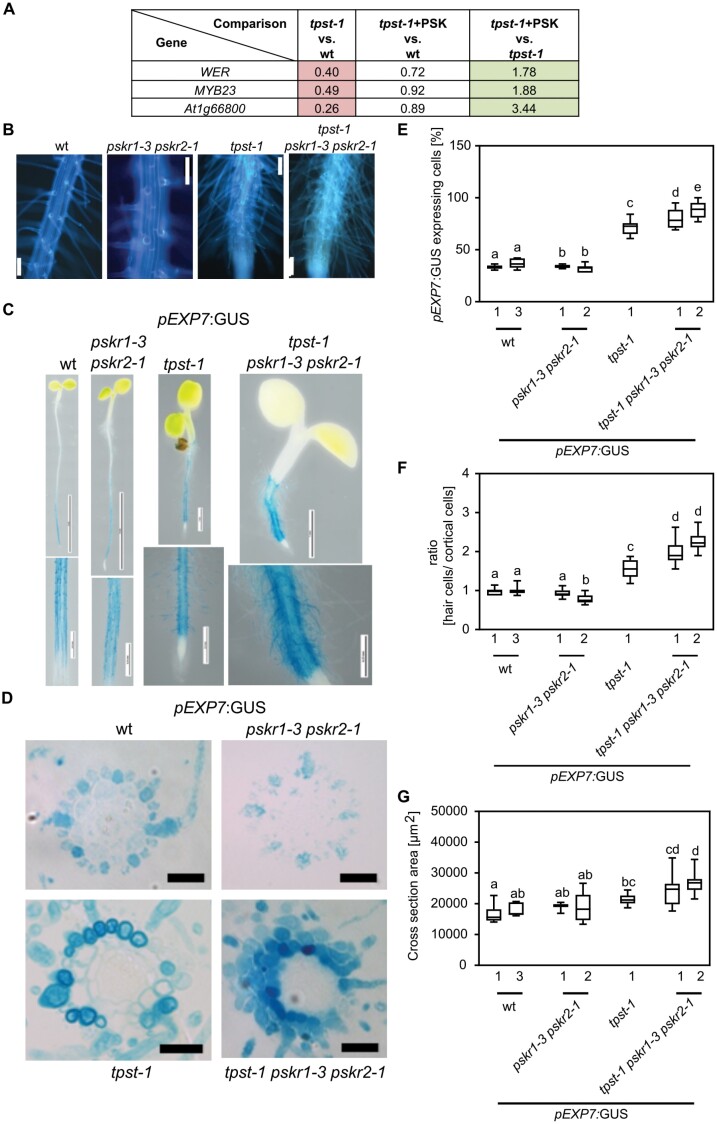
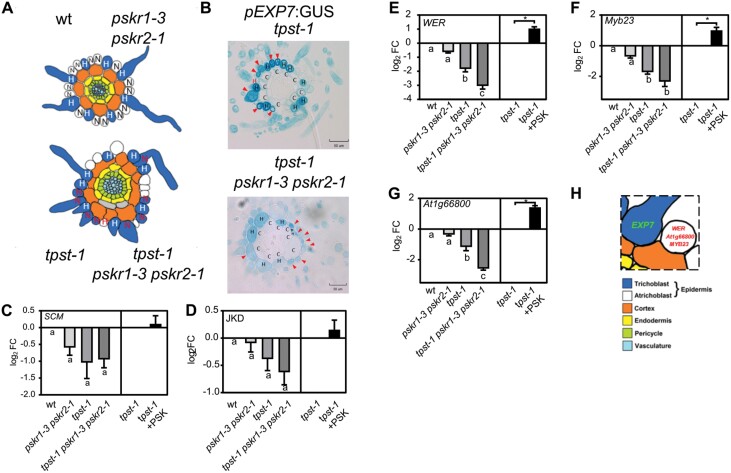
Tyrosine-sulfated peptides are key regulators of plant growth and development. The disulfated pentapeptide phytosulfokine (PSK) mediates growth via leucine-rich repeat receptor-like kinases, PSKR1 and PSKR2. PSK receptors (PSKRs) are part of a response module at the plasma membrane that mediates short-term growth responses, but downstream signaling of transcriptional regulation remains unexplored. In Arabidopsis, tyrosine sulfation is catalyzed by a single-copy gene (TPST; encoding tyrosylprotein sulfotransferase). We performed a microarray-based transcriptome analysis in the tpst-1 mutant background that lacks sulfated peptides to identify PSK-regulated genes and genes that are regulated by other sulfated peptides. Of the 169 PSK-regulated genes, several had functions in root growth and development, in agreement with shorter roots and a higher lateral root density in tpst-1. Further, tpst-1 roots developed higher numbers of root hairs, and PSK induced expression of WEREWOLF (WER), its paralog MYB DOMAIN PROTEIN 23 (MYB23), and At1g66800 that maintain non-hair cell fate. The tpst-1 pskr1-3 pskr2-1 mutant showed even shorter roots, and higher lateral root and root hair density than tpst-1, revealing unexpected synergistic effects of ligand and PSKR deficiencies. While residual activities may exist, overexpression of PSKR1 in the tpst-1 background induced root growth, suggesting that PSKR1 may be active in the absence of sulfated ligands.

Keywords: Arabidopsis; atrichoblast; phytosulfokine; root development; root hair; sulfated peptide signaling; transcriptome; tyrosylprotein sulfotransferase.


Figures

Fig. 1.
Fig. 1.
Transcriptomic analysis of genes regulated by sulfated peptides. (A) Representative seedlings of the wild type (wt), tpst-1, and tpst-1 treated with 1 µM PSK grown for 5 d under long-day conditions. Complete roots were harvested and material was subjected to microarray analysis. Scale bar=1 cm. (B) Table with numbers of down- and up-regulated genes and the total number of genes regulated. The different samples compared are tpst-1 versus the wt, tpst-1+PSK versus the wt, and tpst-1+PSK versus tpst-1. The microarray experiment was performed with three biological replicates each. A cut-off at a P-value of 0.001 was used to indicate differentially expressed genes combined with a cut-off at an FC of 2. (C) Venn diagram of genes regulated between the different genotypes and treatments. Total numbers of genes regulated are given.
Fig. 2.
Fig. 2.
Identification of (over-represented) genes regulated by PSK. (A) Venn diagram that illustrates the number of genes regulated in the tpst-1 versus the wild type (wt) and tpst-1+PSK versus tpst-1. The overlap between these samples identifies the number of genes that are regulated by PSK. (B) Biological processes that are over-represented among the genes that are regulated by PSK. The identified genes were analyzed by the PANTHER16.0 program (Mi et al., 2019, 2021). A total of 92 genes could be assigned to specific, over-represented biological processes.
Fig. 3.
Fig. 3.
Verification of PSK-regulated genes in Arabidopsis roots by qPCR. (A) Table of chosen genes identified as PSK regulated within the microarray analysis. Six genes were chosen that were regulated by PSK, but not significantly regulated in tpst-1+PSK versus the wild type (wt). (B–G) Fold change of expression tested by qPCR of (B) At5g42600 (MRN1), (C) At3g25820 (TPS23), (D) At5g47990 (THAD1), (E) At5g41290 (a receptor-like kinase), (F) At2g43140 (BHLH129), and (G) At4g15370 (BARS1). Roots were harvested from seedlings grown for 5 d under control conditions or treated with 1 µM PSK. qPCR was performed on three biological replicates with two technical repeats, and gene expression was normalized to two reference genes. Results are shown as fold changes in tpst-1 versus the wt and tpst-1+PSK versus tpst-1. Each time point included pooled plant material of several independent seedlings. * and *** indicate significant differences compared with the control at P<0.05 or P<0.001, respectively (two-tailed t-test).
Fig. 4.
Fig. 4.
A tpst-1 pskr1-3 pskr2-1 triple mutant shows an unexpected, synergistic phenotype. (A) Representative seedlings of the wild type (wt), pskr1-3 pskr2-1, tpst-1, and tpst-1 pskr1-3 pskr2-1 grown with or without 1 µM PSK for 5 d under long-day conditions. Scale bar=1 cm. (B) Root length (mm) of the 5-day-old wt, pskr1-3 pskr2-1, tpst-1, and tpst-1 pskr1-3 pskr2-1 treated without or with 1 µM PSK. (C, D) Representative images of the respective genotypes grown (C) for 3 weeks under sterile conditions with and without PSK or (D) for 4 weeks on soil under long-day conditions. (E) Representative images of plants grown for 11 d under sterile growth conditions. For wt, tpst-1, pskr1-3 pskr2-1, and tpst-1 pskr1-3 pskr2-1, a representative example of lateral root development is shown. Scale bars represent the indicated lengths. (F) Number of lateral roots and (G) lateral root density of 11-day old plants of the wt, pskr1-3 pskr2-1, tpst-1, and tpst-1 pskr1-3 pskr2-1. The root and the shoot were separated and lateral roots were spread to determine initiation sites of lateral roots. Experiments were performed at least three times with similar results. Data are shown for one representative experiment as the mean ±SE, (B) n≥68, (F) n≥46, (G) n≥46. Different letters indicate significant differences (Kruskal–Wallis, P<0.05). In (B), controls were compared by Kruskal–Wallis (P<0.05) and significance between control and PSK treatment was tested by a two-tailed t-test. *** and * indicate significant differences at P<0.001 or P<0.05, respectively.
Fig. 5.
Fig. 5.
Overexpression of PSKR1 in the tpst-1 background promotes root growth. (A, C) Representative seedlings of the wild type (wt), tpst-1, p35S:PSKR1-GFP tpst-1, and p35S:PSKR2-GFP tpst-1 grown for 5 d without (A, C) and with 1 µM PSK (A). (B, D) Root lengths (mm) of (B) the wt, tpst-1, and two independent lines of p35S:PSKR1-GFP tpst-1, and (D) the wt, tpst-1, and p35S:PSKR1-GFP tpst-1 supplemented without (B, D) or with 1 µM PSK (B). Numbers indicate independent transgenic lines. (B) Experiments were performed at least three times with similar results. Data are shown for one representative experiment as the mean ±SE. (D) The experiment was performed once. Data are shown as the mean ±SE. (B) n≥31, (D) n≥122. In (B), *** indicates significant differences from the wt control at P<0.001 (two-tailed t-test). ### indicates a significant difference in comparison with the untreated control at P<0.001 (two-tailed t-test). In (D), different letters indicate significant differences (Kruskal–Wallis, P<0.05). In (A) and (C), scale bars represent 1 cm.
Fig. 6.
Fig. 6.
TPST and PSKRs control root hair formation by altering position-dependent epidermal cell fate determination. (A) Table with fold change of WER, MYB23, and At1g66800 identified from the microarray experiment. Microarray experiments were performed with three biological replicates. (B) Autofluorescence imaging of the root hair zone of the wild type (wt), pskr1-3 pskr2-1, tpst-1, and tpst-1 pskr1-3 pskr2-1. Scale bar=100 µm. (C) Representative images of 5-day-old wt, pskr1-3 pskr2-1, tpst-1, and tpst-1 pskr1-3 pskr2-1 seedlings expressing pEXP7:GUS. Scale bars represent the indicated lengths. (D) Representative cross-sections of 5-day-old pEXP7:GUS seedlings; scale bar=50 µm. (E) Quantification of cells expressing pEXP7:GUS as a marker for trichoblasts. (F) Ratio of pEXP7:GUS-expressing hair cells to cortical cells in the genotypes indicated. (G) Cross-sectional area (µm2) determined from cross-sections of pEXP7p:GUS-expressing seedlings. Numbers indicate independent transgenic lines. Experiments were performed at least three times with similar results. Data are shown for one representative experiment as the mean ±SE, (E) n≥9, (F) n≥9, (G) n≥9. Different letters indicate significant differences (Kruskal–Wallis, P<0.05).
Fig. 7.
Fig. 7.
TPST and PSKRs control root hair formation by regulation of three marker genes for non-hair cell fate. (A) Schematic presentation indicating the position of trichoblasts and cortical cells. Trichoblasts are in an H (root hair) position in the wild type (wt) and pskr1-3 pskr2-1. In tpst-1 and tpst-1 pskr1-3 pskr2-1, they are developed in H and N (non-hair root) positions. (B) Representative cross-sections of 5-day-old tpst-1 and tpst-1 pskr1-3 pskr2-1 seedlings expressing pEXP7:GUS. Arrows indicate pEXP7:GUS-expressing cells in the N position.The red H marks a cell that is in an H position, but does not express pEXP7:GUS. Scale bars=50 µm (C–G) Log2 fold change of expression tested by qPCR of non-hair cell fate marker genes (C) SCM (LRR receptor-like kinase Scrambled), (D) JKD (Jackdaw), (E) WER (Werewolf), (F) Myb23, and (G) At1g66800. Seedlings were grown for 5 d under control conditions or treated with 1 µM PSK and subjected to RT–qPCR analysis. RT–qPCR was performed on three biological replicates with two technical repeats, and gene expression was normalized to two reference genes and is shown as log2 fold change. Each time point included pooled plant material of several independent seedlings. Asterisks indicate significant differences between tpst-1 and tpst-1 treated with PSK. Different letters indicate significant differences (Kruskal–Wallis, P<0.05). (H) Schematic presentation indicating expression of marker genes EXP7, WER, MYB23, and At1g66800 in Arabidopsis wt seedlings.

Similar articles

Cited by

References

    1. Amano Y, Tsubouchi H, Shinohara H, Ogawa M, Matsubayashi Y. 2007. Tyrosine-sulfated glycopeptide involved in cellular proliferation and expansion in Arabidopsis. Proceedings of the National Academy of Sciences, USA 104, 18333–18338. - PMC - PubMed
    1. Benjamini Y, Hochberg Y. 1995. Controlling the false discovery rate: a practical and powerful approach to multiple testing. Journal of the Royal Statistical Society 57, 289–300.
    1. Chen YF, Matsubayashi Y, Sakagami Y. 2000. Peptide growth factor phytosulfokine-alpha contributes to the pollen population effect. Planta 211, 752–755. - PubMed
    1. Cho HT, Cosgrove DJ. 2002. Regulation of root hair initiation and expansin gene expression in Arabidopsis. The Plant Cell 14, 3237–3253. - PMC - PubMed
    1. Deal RB, Henikoff S. 2010. A simple method for gene expression and chromatin profiling of individual cell types within a tissue. Developmental Cell 18, 1030–1040. - PMC - PubMed

Publication types

MeSH terms

LinkOut - more resources