

FOXD1 is a prognostic biomarker and correlated with macrophages infiltration in head and neck squamous cell carcinoma
- PMID: 34028536
- PMCID: PMC8255535
- DOI: 10.1042/BSR20202929
FOXD1 is a prognostic biomarker and correlated with macrophages infiltration in head and neck squamous cell carcinoma
Abstract
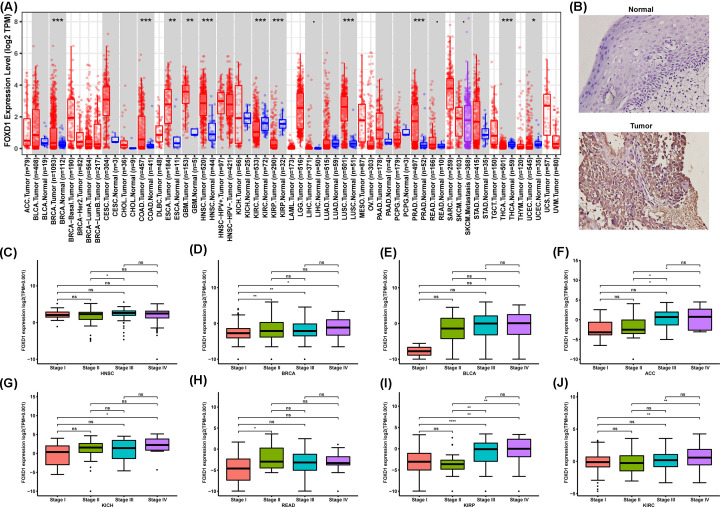
Background: Forkhead Box D1 (FOXD1) is differentially expressed in various tumors. However, its role and correlation with immune cell infiltration remains uncertain in head and neck squamous cell carcinoma (HNSC).
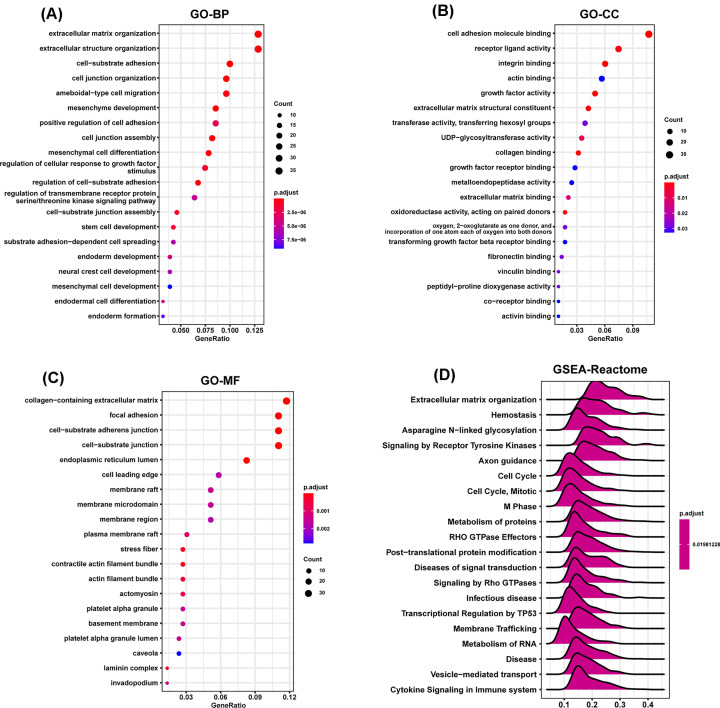
Methods: FOXD1 expression was analyzed in The Cancer Genome Atlas (TCGA) pan-cancer data. The clinical prognosis influence of FOXD1 was evaluated by clinical survival data of TCGA. Enrichment analysis of FOXD1 was performed using R packages 'clusterProfiler'. We downloaded the immune cell infiltration score of TCGA samples from published articles, and analyzed the correlation between immune cell infiltration level and FOXD1 expression.
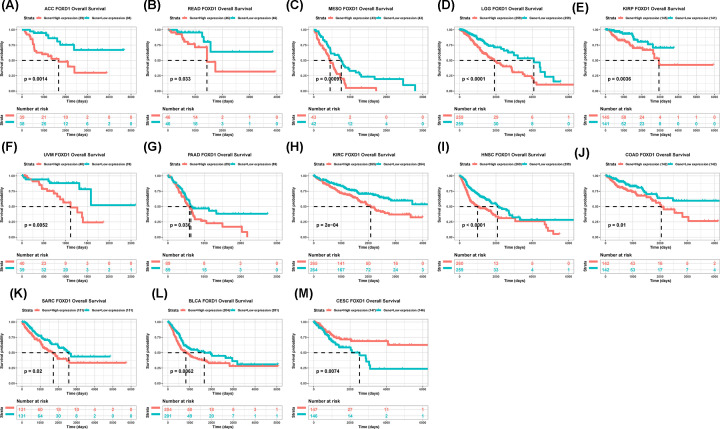
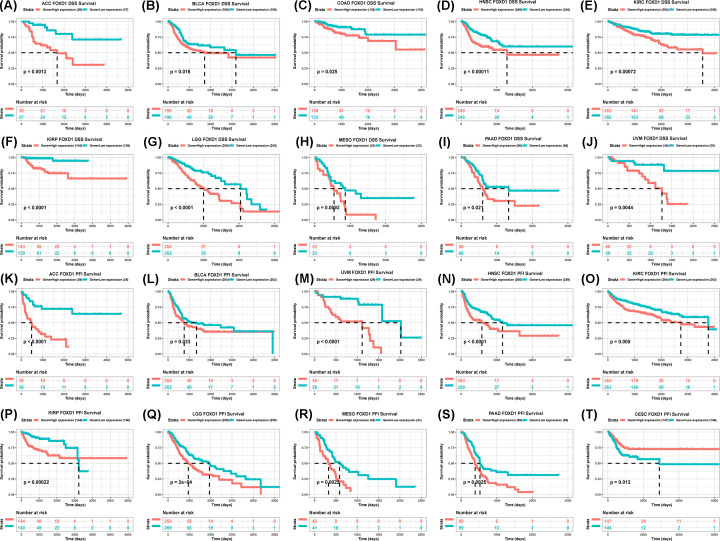
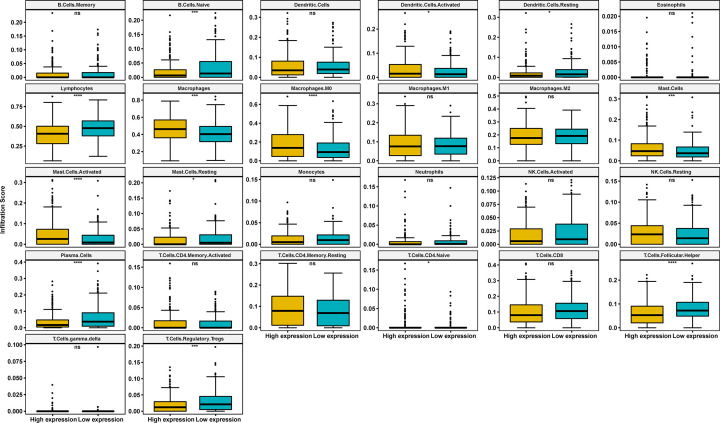
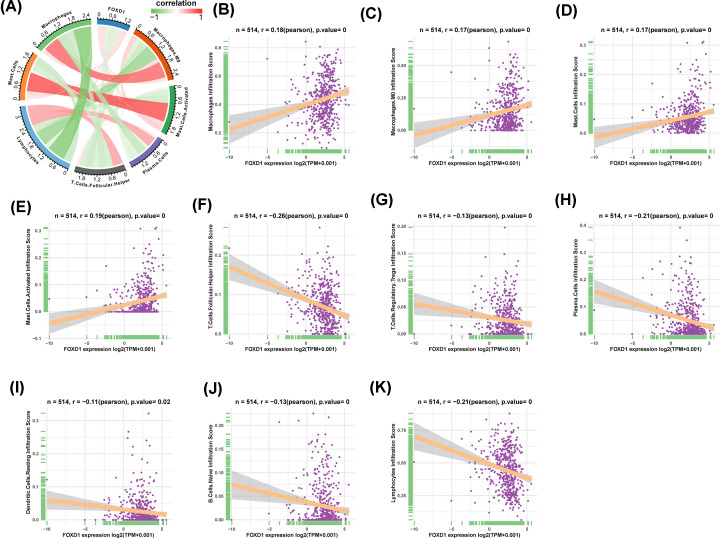
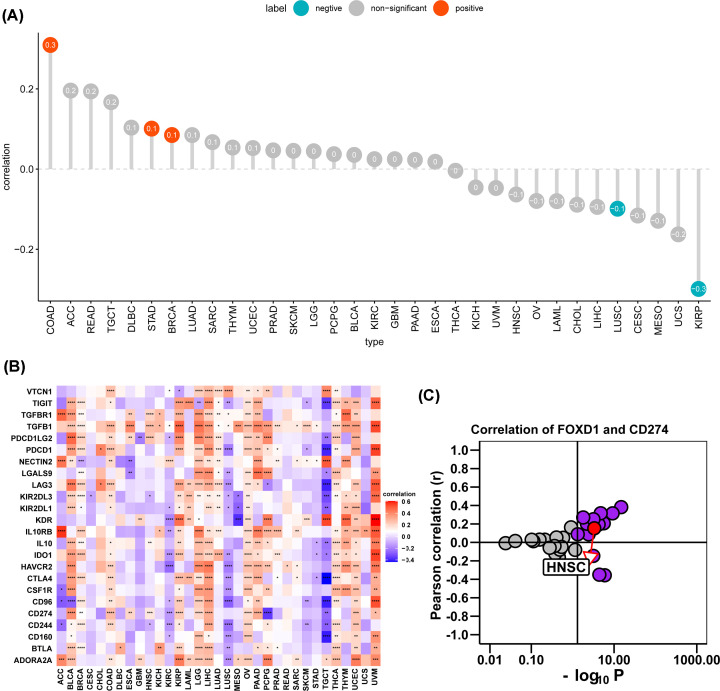
Results: FOXD1 was highly expressed and associated with poorer overall survival (OS, P<0.0001), disease-specific survival (DSS, P=0.00011), and progression-free interval (PFI, P<0.0001) in HNSC and some other tumors. In addition, FOXD1 expression was significantly correlated with infiltration of immune cells. Tumor-associated macrophages (TAMs) infiltration increased in tissues with high FOXD1 expression in HNSC. Immunosuppressive genes such as PD-L1, IL-10, TGFB1, and TGFBR1 were significantly positively correlated with FOXD1.
Conclusions: Our study suggests FOXD1 to be an oncogene and act as an indicator of poor prognosis in HNSC. FOXD1 might contribute to the TAM infiltration in HNSC. High FOXD1 may be associated with tumor immunosuppression status.
Keywords: FOXD1; HNSC; Pan-cancer; TAM infiltration; TCGA; immunosuppression status.
© 2021 The Author(s).
Conflict of interest statement
The authors declare that there are no competing interests associated with the manuscript.
Figures
Similar articles
-
FOXD1 expression in head and neck squamous carcinoma: a study based on TCGA, GEO and meta-analysis.Biosci Rep. 2021 Jul 30;41(7):BSR20210158. doi: 10.1042/BSR20210158. Biosci Rep. 2021. PMID: 34269372 Free PMC article.
-
Profiles of immune cell infiltration in head and neck squamous carcinoma.Biosci Rep. 2020 Feb 28;40(2):BSR20192724. doi: 10.1042/BSR20192724. Biosci Rep. 2020. PMID: 32095823 Free PMC article.
-
DNA-methylome-derived epigenetic fingerprint as an immunophenotype indicator of durable clinical immunotherapeutic benefits in head and neck squamous cell carcinoma.Cell Oncol (Dordr). 2024 Aug;47(4):1129-1148. doi: 10.1007/s13402-024-00917-x. Epub 2024 Feb 5. Cell Oncol (Dordr). 2024. PMID: 38315286
-
Prognostic significance of Dickkopf-1 in head and neck squamous cell carcinoma.Expert Rev Anticancer Ther. 2024 Mar-Apr;24(3-4):147-154. doi: 10.1080/14737140.2023.2289597. Epub 2023 Dec 5. Expert Rev Anticancer Ther. 2024. PMID: 38044867 Review.
-
Tumor immune microenvironment in head and neck cancers.Mol Carcinog. 2020 Jul;59(7):766-774. doi: 10.1002/mc.23162. Epub 2020 Feb 3. Mol Carcinog. 2020. PMID: 32017286 Free PMC article. Review.
Cited by
-
The Role of Immune Modulatory Cytokines in the Tumor Microenvironments of Head and Neck Squamous Cell Carcinomas.Cancers (Basel). 2022 Jun 11;14(12):2884. doi: 10.3390/cancers14122884. Cancers (Basel). 2022. PMID: 35740551 Free PMC article. Review.
-
Neural crest-associated gene FOXD1 induces an immunosuppressive microenvironment by regulating myeloid-derived suppressor cells in melanoma.J Immunother Cancer. 2025 Apr 9;13(4):e010352. doi: 10.1136/jitc-2024-010352. J Immunother Cancer. 2025. PMID: 40210238 Free PMC article.
-
FOXD1 expression-based prognostic model for uveal melanoma.Heliyon. 2023 Oct 23;9(11):e21333. doi: 10.1016/j.heliyon.2023.e21333. eCollection 2023 Nov. Heliyon. 2023. PMID: 38027647 Free PMC article.
References
Publication types
MeSH terms
Substances
LinkOut - more resources
Full Text Sources
Other Literature Sources
Medical
Research Materials
Miscellaneous