. 2021 Nov 18;37(22):4100-4107.
doi: 10.1093/bioinformatics/btab404.

Interfacing Seurat with the R tidy universe

Affiliations

Interfacing Seurat with the R tidy universe

Stefano Mangiola et al. Bioinformatics. .

Abstract

Motivation: Seurat is one of the most popular software suites for the analysis of single-cell RNA sequencing data. Considering the popularity of the tidyverse ecosystem, which offers a large set of data display, query, manipulation, integration and visualization utilities, a great opportunity exists to interface the Seurat object with the tidyverse. This interface gives the large data science community of tidyverse users the possibility to operate with familiar grammar.

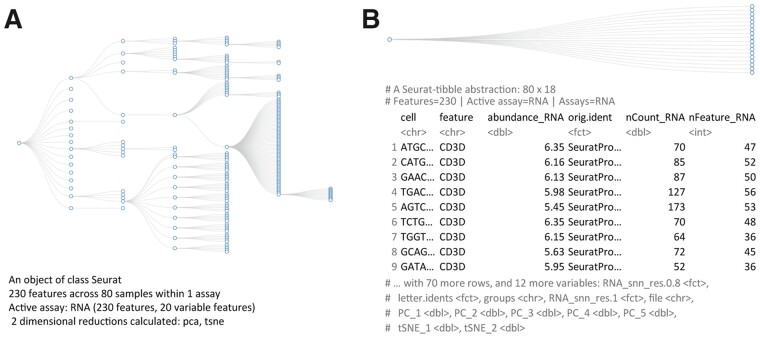
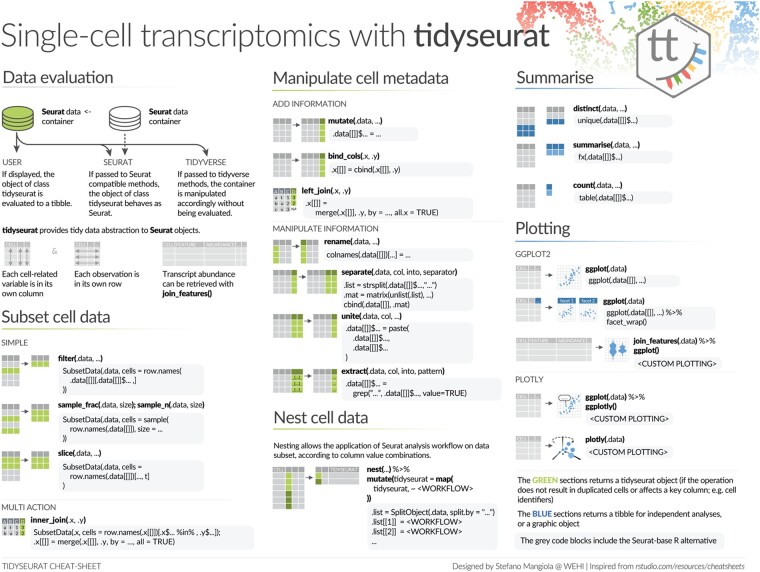
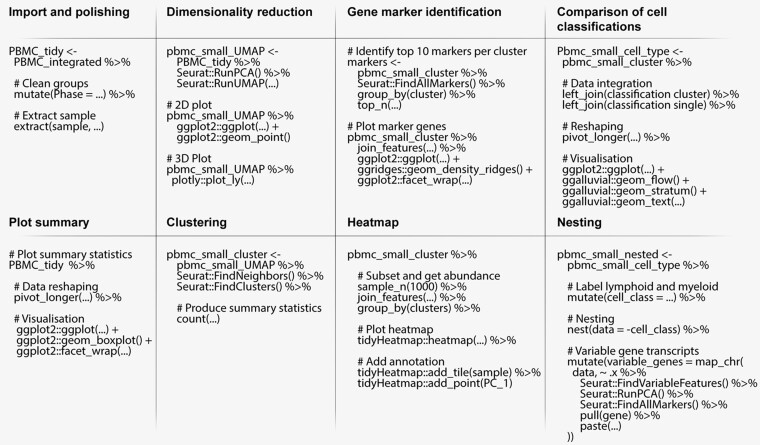
Results: To provide Seurat with a tidyverse-oriented interface without compromising efficiency, we developed tidyseurat, a lightweight adapter to the tidyverse. Tidyseurat displays cell information as a tibble abstraction, allowing intuitively interfacing Seurat with dplyr, tidyr, ggplot2 and plotly packages powering efficient data manipulation, integration and visualization. Iterative analyses on data subsets are enabled by interfacing with the popular nest-map framework.

Availability and implementation: The software is freely available at cran.r-project.org/web/packages/tidyseurat and github.com/stemangiola/tidyseurat.

Supplementary information: Supplementary data are available at Bioinformatics online.


Figures

Fig. 1.
Fig. 1.
Comparison between the data structure (https://github.com/boxuancui/DataExplorer) (top; abstracted tibble for tidyseurat) and the information presented to the user (bottom) for Seurat (A) and tidyseurat (B; including transcript information). The dataset underlying these visualizations is a subset of a peripheral blood mononuclear cell fraction provided by 10× (10xgenomics.com)
Fig. 2.
Fig. 2.
A cheat sheet of the tidyverse functionalities that tidyseurat enables for Seurat objects. This cheat sheet provides examples of the alternative tidyverse and Seurat syntax. The green colour scheme includes procedures that output a tidyseurat, if: (i) do not lead cell duplication; and (ii) key columns (e.g. cell identifier) are not excluded, modified, nor renamed (e.g. through a select, mutate and rename commands). In this case, a table (rather than an abstraction) is returned for independent analysis and visualization. The blue colour scheme includes procedures that return tibble tables for independent analyses and plotting. The grey-shaded boxes include the alternative code utilizing Seurat and base-R.
Fig. 3.
Fig. 3.
Pseudo-code representing procedures for the analysis of single-cell RNA sequencing data integrating Seurat and tidyverse functions through tidyseurat. For functions that are not part of tidyseurat nor base R, package prefixes were added
Fig. 4.
Fig. 4.
Tidyverse-compatible libraries offer powerful, flexible and extensible tools to visualize single-cell RNA sequencing data. Natively interfacing with such tools expands the possibilities for the user to learn from the data. Graphical results of the example workflow, integrating Seurat and tidyverse with tidyseurat. (A) Sample-wise distribution of biological indicators, including the proportion of mitochondrial transcripts and cell-cycle phase scores. For optimum visualization, a 20% subsampling was performed on the cell set. (B) Cells mapped in two- and three-dimensional UMAP space. The default integration of reduced dimensions and other cell-wise information in a tibble abstraction facilitates such visualization. (C) Distribution of transcript abundance for two marker genes, identified for each cluster identified by unsupervised estimation. Cells mapped in two-dimensional Uniform Manifold Approximation and Projection (UMAP) space. (D) Mapping of cells between the cell- or cluster-wise methods for cell-type classification. Only large clusters are labelled here. The colour scheme refers to cell types classified according to clusters. The bottom containers refer to the classification based on single cells. (E) Heatmap of the marker genes for cell clusters, produced with tidyHeatmap, annotated with data source and the first principal component. Only the ten largest clusters are displayed. The integrated visualization of transcript abundance, cell annotation and reduced dimensions is facilitated by the ‘join_features’ functionality and by the default complete integration of cell-wise information (including reduced dimensions) in the tibble abstraction
Fig. 5.
Fig. 5.
Presence of gamma delta T cells among lymphocytes, part of the case study for comparing Seurat with tidyseurat. (A) Integrative UMAP plot including both the signature score and the genes within the signature. Plots are faceted horizontally for biological condition (artifactual). (B) Interactive gating of high scoring cells for the gamma delta T cell signature (Pizzolato et al., 2019), using tidygate (github.com/stemangiola/tidygate). (C) Distribution of the proportion of gamma delta T cells across patients from conditions A and B

Similar articles

Cited by

References

    1. Abdelaal T. et al. (2019) A comparison of automatic cell identification methods for single-cell RNA sequencing data. Genome Biol., 20, 194. - PMC - PubMed
    1. Alquicira-Hernandez J. et al. (2019) scPred: accurate supervised method for cell-type classification from single-cell RNA-seq data. Genome Biol., 20, 264. - PMC - PubMed
    1. Amezquita R.A. et al. (2020) Orchestrating single-cell analysis with Bioconductor. Nat. Methods, 17, 4100–4107.. - PMC - PubMed
    1. Aran D. et al. (2019) Reference-based analysis of lung single-cell sequencing reveals a transitional profibrotic macrophage. Nat. Immunol., 20, 163–172. - PMC - PubMed
    1. Bojanowski M., Edwards R. (2016) Alluvial: r package for creating alluvial diagrams. R Package Version 0. 1, 2.

Publication types