

The Correlation Between COVID-19 Activities and Climate Factors in Different Climate Types Areas
- PMID: 34029299
- PMCID: PMC8327769
- DOI: 10.1097/JOM.0000000000002274
The Correlation Between COVID-19 Activities and Climate Factors in Different Climate Types Areas
Abstract
Objective: To investigate the epidemiological characteristics of human infection with corona virus disease 2019 (COVID-19) in Moscow, Lima, Kuwait, and Singapore to analyze the effects of climate factors on the incidence of COVID-19.
Methods: Collect the daily incidence of COVID-19 and related climate data in four areas, construct a negative binomial regression model, and analyze the correlation between the incidence of COVID-19 and meteorological factors.
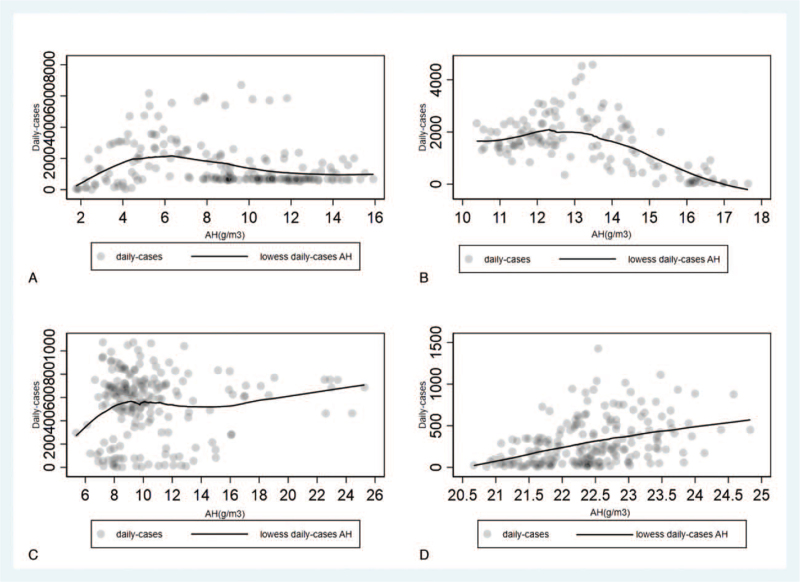
Results: AH was the climate factor affecting the incidence of COVID-19 in Moscow, Lima, and Singapore; Ta and RH were the climate factors affecting the incidence of COVID-19 in Kuwait.
Conclusions: The incidence of COVID-19 in four areas were all associated with the humidity, and climate factors should be taken into consideration when epidemic prevention measures are taken, and environment humidification may be a feasible approach to decrease COVID-19 virus transmission.
Copyright © 2021 American College of Occupational and Environmental Medicine.
Conflict of interest statement
The authors report no conflicts of interest.
Figures


References
-
- Huy C, Kuhn D, Zöllner SSI. Seasonal waves of influenza and cause-specific mortality in Germany. Cent Eur J Med 2012; 7:450–456.
-
- Yuan JS, Yun HM, Lan W, et al. Epidemiological study of association between climate determinants and spread of Severe Acute Respiratory Syndrome (SARS) in Beijing. J Grad School Chin Acad Sci 2005; 22:579–588. (in Chinese).
MeSH terms
LinkOut - more resources
Full Text Sources
Other Literature Sources
Medical
