

Improvement in air quality and its impact on land surface temperature in major urban areas across India during the first lockdown of the pandemic
- PMID: 34029544
- PMCID: PMC9189601
- DOI: 10.1016/j.envres.2021.111280
Improvement in air quality and its impact on land surface temperature in major urban areas across India during the first lockdown of the pandemic
Abstract
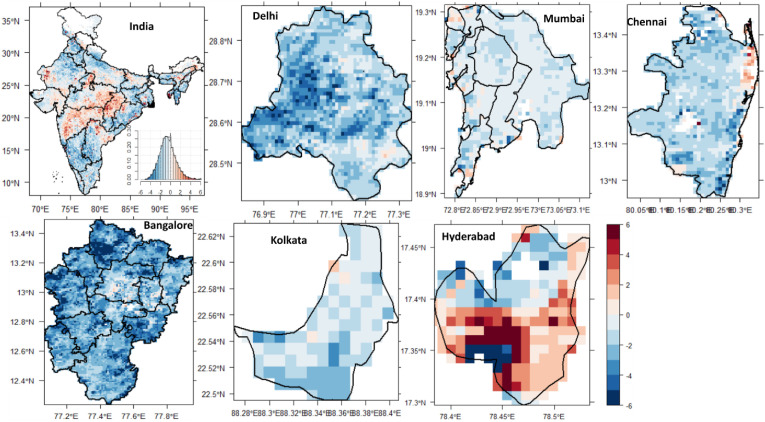
The SARS CoV-2 (COVID-19) pandemic and the enforced lockdown have reduced the use of surface and air transportation. This study investigates the impact of the lockdown restrictions in India on atmospheric composition, using Sentinel-5Ps retrievals of tropospheric NO2 concentration and ground-station measurements of NO2 and PM2.5 between March-May in 2019 and 2020. Detailed analysis of the changes to atmospheric composition are carried out over six major urban areas (i.e. Delhi, Mumbai, Kolkata, Chennai, Bangalore, and Hyderabad) by comparing Moderate Resolution Imaging Spectroradiometer (MODIS) Aerosol Optical Depth (AOD) and land surface temperature (LST) measurements in the lockdown year 2020 and pre-lockdown (2015-2019). Satellite-based data showed that NO2 concentration reduced by 18% (Kolkata), 29% (Hyderabad), 32-34% (Chennai, Mumbai, and Bangalore), and 43% (Delhi). Surface-based concentrations of NO2, PM2.5, and AOD also substantially dropped by 32-74%, 10-42%, and 8-34%, respectively over these major cities during the lockdown period and co-located with the intensity of anthropogenic activity. Only a smaller fraction of the reduction of pollutants was associated with meteorological variability. A substantial negative anomaly was found for LST both in the day (-0.16 °C to -1 °C) and night (-0.63 °C to -2.1 °C) across select all cities, which was also consistent with air temperature measurements. The decreases in LST could be associated with a reduction in pollutants, greenhouse gases and water vapor content. Improvement in air quality with lower urban temperatures due to lockdown may be a temporary effect, but it provides a crucial connection among human activities, air pollution, aerosols, radiative flux, and temperature. The lockdown for a shorter-period showed a significant improvement in environmental quality and provides a strong evidence base for larger scale policy implementation to improve air quality.
Keywords: AOD; Atmospheric pollutants; LST; Net radiative flux; Water vapor.
Copyright © 2021 Elsevier Inc. All rights reserved.
Conflict of interest statement
The authors declare that they have no known competing financial interests or personal relationships that could have appeared to influence the work reported in this paper.
Figures


Similar articles
-
Changes in air pollution, land surface temperature, and urban heat islands during the COVID-19 lockdown in three Chinese urban agglomerations.Sci Total Environ. 2023 Sep 20;892:164496. doi: 10.1016/j.scitotenv.2023.164496. Epub 2023 May 29. Sci Total Environ. 2023. PMID: 37257592 Free PMC article.
-
Impact of COVID-19 lockdown on ambient air quality in megacities of India and implication for air pollution control strategies.Environ Sci Pollut Res Int. 2021 May;28(17):21621-21632. doi: 10.1007/s11356-020-11808-7. Epub 2021 Jan 7. Environ Sci Pollut Res Int. 2021. PMID: 33415615 Free PMC article.
-
Unprecedented reduction in air pollution and corresponding short-term premature mortality associated with COVID-19 lockdown in Delhi, India.J Air Waste Manag Assoc. 2021 Sep;71(9):1085-1101. doi: 10.1080/10962247.2021.1905104. Epub 2021 Apr 15. J Air Waste Manag Assoc. 2021. PMID: 33764280
-
Geospatial analysis of COVID-19 lockdown effects on air quality in the South and Southeast Asian region.Sci Total Environ. 2021 Feb 20;756:144009. doi: 10.1016/j.scitotenv.2020.144009. Epub 2020 Nov 21. Sci Total Environ. 2021. PMID: 33250248 Free PMC article.
-
COVID-19 lockdown and environmental pollution: an Indian multi-state investigation.Environ Monit Assess. 2022 Jan 3;194(2):49. doi: 10.1007/s10661-021-09693-9. Environ Monit Assess. 2022. PMID: 34978634 Free PMC article. Review.
Cited by
-
SARS-CoV-2 and other pathogens in municipal wastewater, landfill leachate, and solid waste: A review about virus surveillance, infectivity, and inactivation.Environ Res. 2022 Jan;203:111839. doi: 10.1016/j.envres.2021.111839. Epub 2021 Aug 4. Environ Res. 2022. PMID: 34358502 Free PMC article.
-
A retrospect of ozone formation mechanisms during the COVID-19 lockdown: The potential role of isoprene.Environ Pollut. 2023 Jan 15;317:120728. doi: 10.1016/j.envpol.2022.120728. Epub 2022 Nov 22. Environ Pollut. 2023. PMID: 36427823 Free PMC article.
-
Impact of COVID-19 induced lockdown on land surface temperature, aerosol, and urban heat in Europe and North America.Sustain Cities Soc. 2021 Dec;75:103336. doi: 10.1016/j.scs.2021.103336. Epub 2021 Sep 5. Sustain Cities Soc. 2021. PMID: 34513574 Free PMC article.
-
A comprehensive study of the COVID-19 impact on PM2.5 levels over the contiguous United States: A deep learning approach.Atmos Environ (1994). 2022 Mar 1;272:118944. doi: 10.1016/j.atmosenv.2022.118944. Epub 2022 Jan 14. Atmos Environ (1994). 2022. PMID: 35043042 Free PMC article.
-
Changes in air pollution, land surface temperature, and urban heat islands during the COVID-19 lockdown in three Chinese urban agglomerations.Sci Total Environ. 2023 Sep 20;892:164496. doi: 10.1016/j.scitotenv.2023.164496. Epub 2023 May 29. Sci Total Environ. 2023. PMID: 37257592 Free PMC article.
References
-
- Abdullah S., Mansor A.A., Napi N.N.L.M., Mansor W.N.W., Ahmed A.N., Ismail M., Ramly Z.T.A. Air quality status during 2020 Malaysia Movement Control Order (MCO) due to 2019 novel coronavirus (2019-nCoV) pandemic. Sci. Total Environ. 2020;729:139022. doi: 10.1016/j.scitotenv.2020.139022. - DOI - PMC - PubMed
-
- Acharya P., Barik G., Gayen B.K., Bar S., Maiti A., Sarkar A., Ghosh S., De S.K., Sreekesh S. Revisiting the levels of Aerosol Optical Depth in south-southeast Asia, Europe and USA amid the COVID-19 pandemic using satellite observations. Environ. Res. 2021;193:110514. doi: 10.1016/j.envres.2020.110514. - DOI - PMC - PubMed
-
- Balakrishnan K., Dey S., Gupta T., Dhaliwal R.S., Brauer M., Cohen A.J., et al. The impact of air pollution on deaths, disease burden, and life expectancy across the states of India: the Global Burden of Disease Study 2017. Lancet Planet. Health. 2019;3:e26–e39. doi: 10.1016/S2542-5196(18)30261-4. - DOI - PMC - PubMed
MeSH terms
Substances
LinkOut - more resources
Full Text Sources
Other Literature Sources
Medical
Miscellaneous
