. 2021 Jul:43:102006.
doi: 10.1016/j.redox.2021.102006. Epub 2021 May 14.

Tumor resistance to ferroptosis driven by Stearoyl-CoA Desaturase-1 (SCD1) in cancer cells and Fatty Acid Biding Protein-4 (FABP4) in tumor microenvironment promote tumor recurrence

Affiliations

Tumor resistance to ferroptosis driven by Stearoyl-CoA Desaturase-1 (SCD1) in cancer cells and Fatty Acid Biding Protein-4 (FABP4) in tumor microenvironment promote tumor recurrence

Géraldine Luis et al. Redox Biol. 2021 Jul.

Abstract

Problem: Tumor recurrence is a major clinical issue that represents the principal cause of cancer-related deaths, with few targetable common pathways. Mechanisms by which residual tumors persist and progress under a continuous shift between hypoxia-reoxygenation after neoadjuvent-therapy are unknown. In this study, we investigated the role of lipid metabolism and tumor redox balance in tumor recurrence.

Methods: Lipidomics, proteomics and mass spectrometry imaging approaches where applied to mouse tumor models of recurrence. Genetic and pharmacological inhibitions of lipid mediators in tumors were used in vivo and in functional assays in vitro.

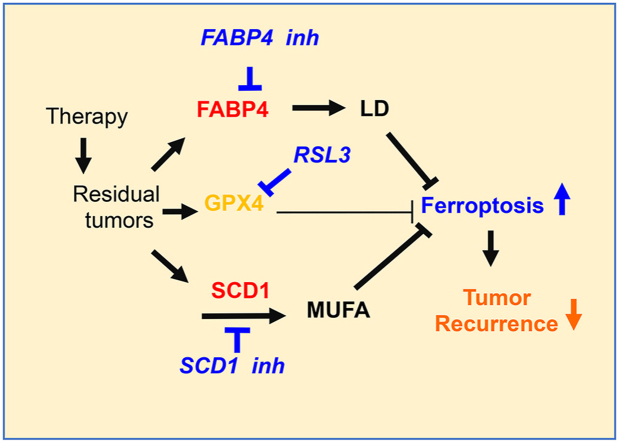
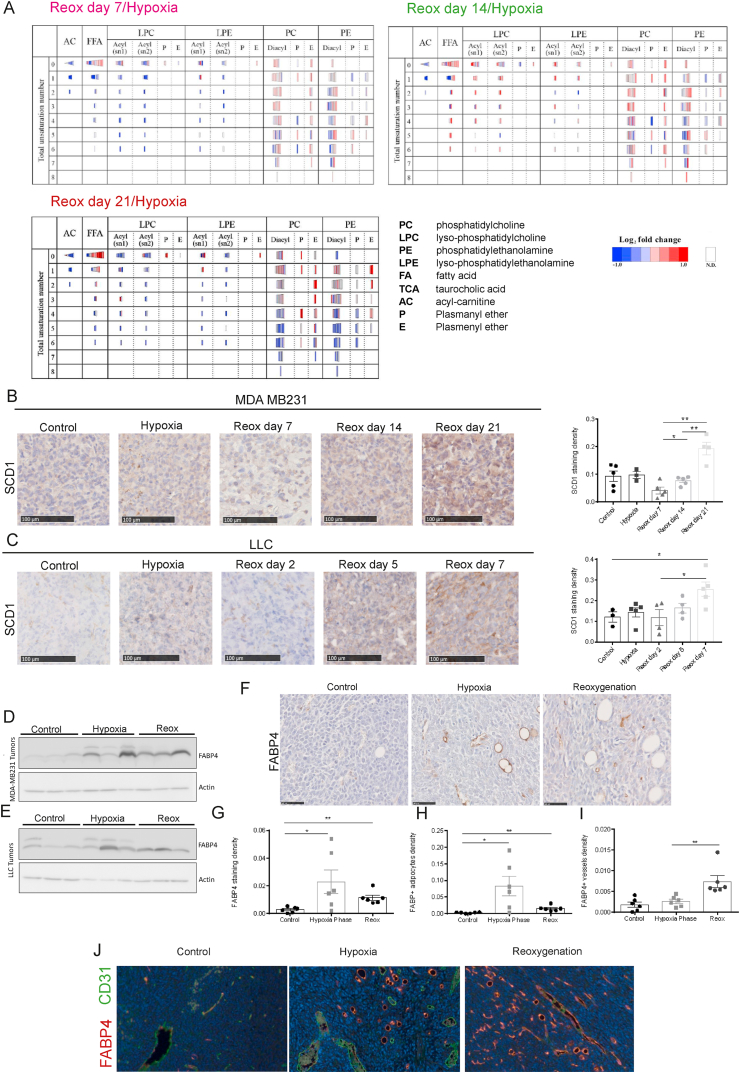
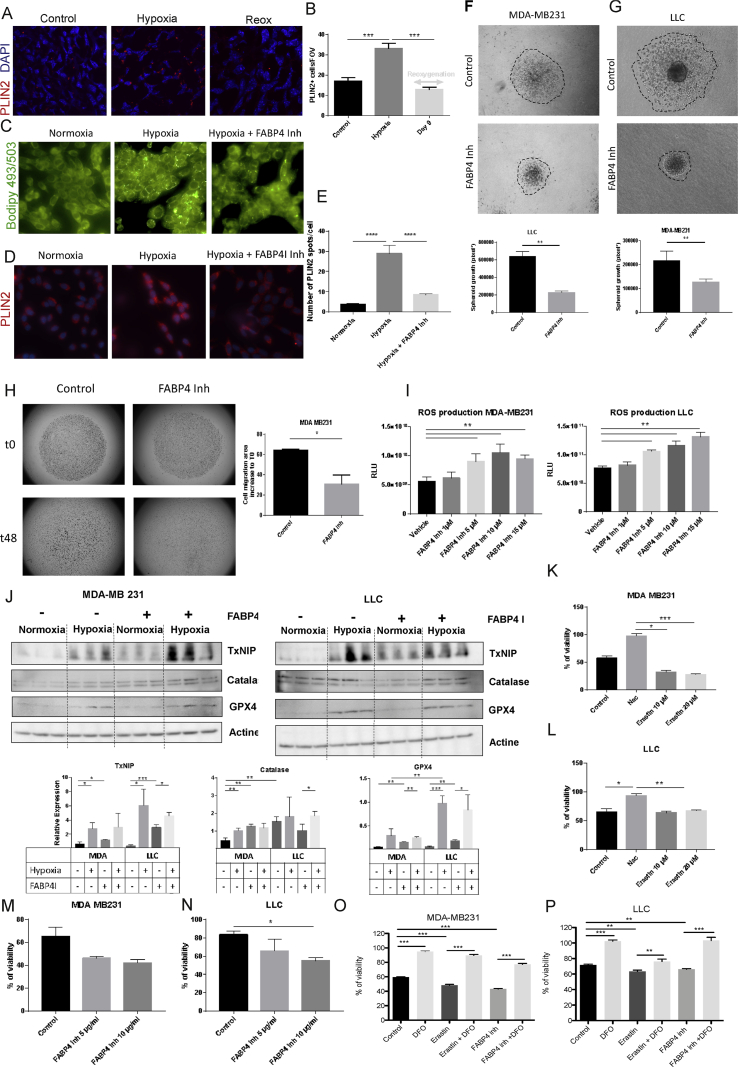
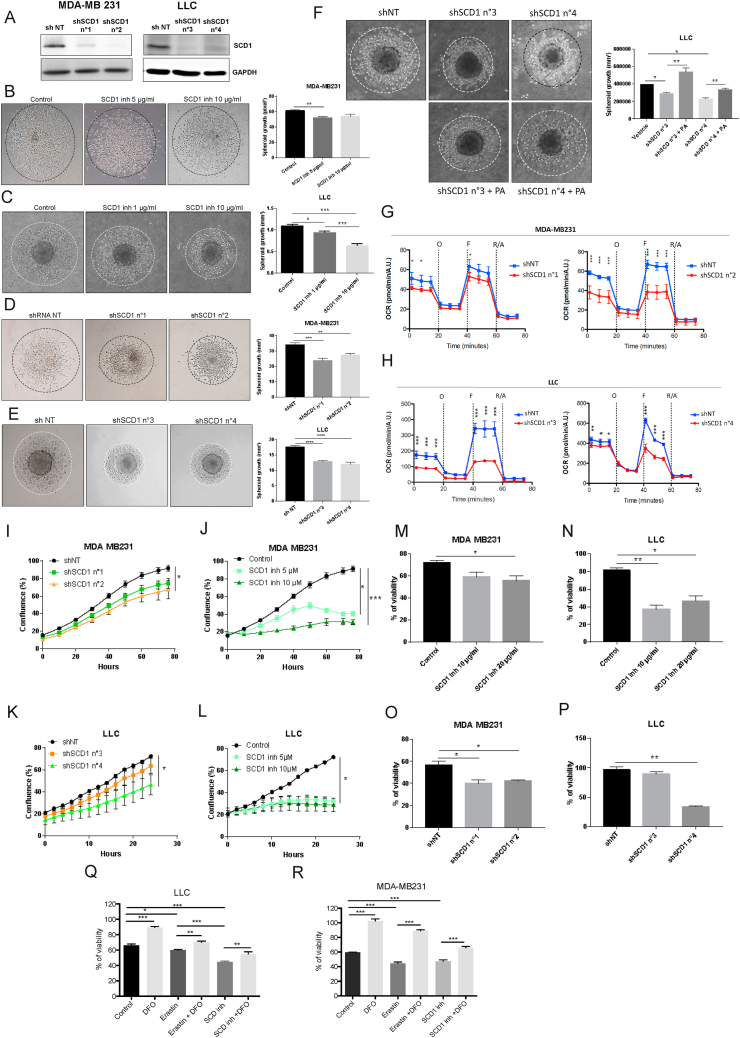
Results: We found that stearoyl-CoA desaturase-1 (SCD1) expressed by cancer cells and fatty acid binding protein-4 (FABP4) produced by tumor endothelial cells (TECs) and adipocytes in the tumor microenvironment (TME) are essential for tumor relapse in response to tyrosine kinase inhibitors (TKI) and chemotherapy. SCD1 and FABP4 were also found upregulated in recurrent human breast cancer samples and correlated with worse prognosis of cancer patients with different types of tumors. Mechanistically, SCD1 leads to fatty acid (FA) desaturation and FABP4 derived from TEM enhances lipid droplet (LD) in cancer cells, which cooperatively protect from oxidative stress-induced ferroptosis. We revealed that lipid mobilization and desaturation elicit tumor intrinsic antioxidant and anti-ferroptotic resources for survival and regrowth in a harsh TME. Inhibition of lipid transport from TME by FABP4 inhibitor reduced tumor regrowth and by genetic - or by pharmacological - targeting SCD1 in vivo, tumor regrowth was abolished completely.

Conclusion: This finding unveils that it is worth taking advantage of tumor lipid addiction, as a tumor vulnerability to design novel treatment strategy to prevent cancer recurrence.

Keywords: Drug-resistance; Hypoxia; Lipid metabolism; ROS-ferroptosis; Reoxygenation; Tumor-microenvironment.


Conflict of interest statement

The authors declare no conflict of interests.

Figures

Image 1
Graphical abstract
Fig. 1
Fig. 1
Enhanced oxidative stress and change in the lipogenic profile of residual tumors. (A) Schematic illustration of the in vivo models of hypoxia-reoxygenation. Mice bearing MDA-MB231 or LLC tumors were treated with tyrosine kinase inhibitor (TKI: sunitinib 40 mg/kg/day) for the indicated periods (hypoxia in blue) and then the treatment was stopped (Reoxygenation). Tumors were collected one day after treatment cessation (day 0) corresponding to the hypoxia-phase or at the indicated time points of reoxygenation-phase after treatment cessation (7, 14 and 21 days for MDA-MB231 tumors and 9 days for LLC tumors). For mice bearing 4T1 tumors, mice were treated by i.p. injection of cisplatin (7 mg/kg/week) for 3 weeks and euthanized 3 days after the last injection (hypoxia-phase) and 14 days after treatment cessation and tumor regrowth (reoxygenation-phase). (B,C) Immunohistochemistry analysis of hypoxia by CAIX staining (images) and computerized quantification of CAIX density (graphs) on whole tumor sections of MDA-MB231 xenografts (B) or LLC tumors (C), collected at indicated time points. *P ≤ 0,05; **P ≤ 0,01. (D) Representative images of immunohistochemistry analysis of hypoxia by CAIX staining of 4T1 tumors treated with vehicle (Control), cisplatin (Hypoxia) and cisplatin discontinuation (Reox). (E, F) Global proteomic analysis of oxidative stress markers in MDA-MB231 xenografts during the reoxygenation-phase as compared to vehicle treated tumors. Human (E) and mouse (F) proteins found in tumor stroma were distinguishable and presented separately. Catalase, SOD1, SOD2, glutathione-S-transferase (GSTM1 and GSTM2) and thioredoxin (TXN) were increased in cancer and stromal cells of tumors in the reoxygenation-phase. (G) Mass spectrometry imaging (MALDI imaging) of lipid species on slides of tumor sections revealing differences in the PCA analysis when comparing tumors in hypoxia to tumors after reoxygenation (Reox at day 7, 14 and 21). (For interpretation of the references to color in this figure legend, the reader is referred to the Web version of this article.)
Fig. 2
Fig. 2
SCD1 and FABP4 are upregulated by hypoxia/reoxygenation in residual tumors (A) Summary of LC-MS analyses of tumors during hypoxia and after different time points of reoxygenation: day 7, 14 and 21. Tables present the lipid profile as ratio between the reoxygenation and the hypoxia phases (red color corresponds to an increase and blue color to a decrease). The vertical axis (0–8) indicates the total unsaturation number. The horizontal axis shows lipid groups and their variants. The length of each bar indicates the total number of carbon atoms. N.D.: not detected; FFA: free fatty acids, Acyl, Diacyl, P (plasmanyl ether) and E (plasmenyl ether) indicate the binding forms of fatty acids. (B, C) Immunohistochemistry analysis (images) and computerized quantification (graphs) of SCD1 staining density in MDA-MB231 (B) and LLC tumors (C) collected at indicated time points. *P ≤ 0,05; **P ≤ 0,01. (D, E) Western blot analysis of FABP4 in MDA-MB231 and (D) LLC tumors (E) treated with vehicle or TKI (hypoxia phase) and after treatment cessation (reoxygenation phase: Reox). Actin-beta was used as loading control. (F) Immunohistochemical analysis of FABP4 in LLC tumors treated with vehicle or TKI (hypoxia phase) and after treatment cessation (reoxygenation phase). (G) Computerized quantification of FABP4 staining density in whole tumor sections of tumors in (F). (H) Quantification of FABP4+ adipocytes in tumors. (I) Quantification of FABP4+ blood vessels in tumors. *P ≤ 0,05; **P ≤ 0,01. (J) Double-immunofluorescent staining of tumor endothelial cells (TECs) with CD31 antibody (green) and FABP4 (red) showing an increase in FABP4+CD31+ cells in tumor after reoxygenation. (For interpretation of the references to color in this figure legend, the reader is referred to the Web version of this article.)
Fig. 3
Fig. 3
SCD1 in cancer cells and FABP4 in the TME are associated with tumor recurrence in mouse and human cancers. (A) Tumor growth curves of 4T1 tumors in BALB/C mice treated with vehicle or cisplatin (7 mg/kg/week) at the indicated time points (up-arrows). Treatment cessation was associated with a rapid tumor regrowth that reached the volume vehicle tumors after 2 weeks of cisplatin washout. (B) Immunohistochemical analysis of FABP4 in 4T1 tumors treated with vehicle or cisplatin and after treatment cessation. (C) Western blot analysis of FABP4 in 4T1 tumors (n = 5) treated with vehicle or cisplatin and after treatment cessation. GAPDH was used as loading control. (D, E) Images of immunohistochemistry analysis of SCD1 (D) and computerized quantification of SCD1 staining density in 4T1 tumors (E) treated with vehicle, cisplatin or after treatment discontinuation. *P ≤ 0,05; **P ≤ 0,01. (F, G) Immunohistochemistry analysis of SCD1 (F) and computerized quantification of staining density (G) on whole tumor sections from human primary breast cancer tumors (n = 23) and their corresponding metastatic relapses (n = 22) after therapies (image showing metastasis in lymph node). *P ≤ 0,05. (H) Immunohistochemistry analysis of FABP4 in human primary breast cancer samples (n = 23and metastatic relapses (n =22) (image showing bone metastasis). Arrows indicate FABP4+ blood vessels (BV). (I) Recurrence-free survival data associated with SCD1 expression levels in human breast cancers. (J) Overall survival (OS) associated with SCD1 expression in the indicated cancers. (K) Recurrence-free survival data associated with FABP4 expression levels in human breast cancers. (L) Overall survival (OS) associated with FABP4 expression in the indicated cancers. (M) Working hypothesis. Left: Residual tumors have enhanced ROS levels and increased expression of FABP4 in TECs and in adipocytes, while SCD1 activity is inhibited by the absence of oxygen. Thus, FABP4 may contribute to lipid uptake and LD formation in cancer cells and survival of residual tumors. Right: Reoxygenation boosts SCD1 activity and MUFA synthesis in cancer cells, along with the sustained expression of FABP4 in TME that can improve PUFA uptake. Lipid mobilization/desaturation and ROS may influence the tumor redox balance, ferroptosis and recurrence. Abbreviations: SFA, saturated fatty acids; MUFA, mono unsaturated fatty acids; PUFA, polyunsaturated fatty acids, PUFA*, free radical of PUFA.
Fig. 4
Fig. 4
FABP4-induced cancer cell migration, lipid droplet (LD) formation in hypoxia and increased cancer cell resistance to ROS-induced ferroptosis. (A–B) Immunofluorescence detection (A) and computerized quantification (B) of the PLIN2 in LLC tumors treated with vehicle or TKI (Hypoxia-phase) and after treatment cessation (Reoxygenation-phase) (n = 5). (C–E) MDA-MB231 cells were incubated under hypoxia or normoxia for 24 h with or without FABP4 inhibitor (FABP4 Inh) (10 μM). Cells were stained for LD with bodipy 493–503 in green (C) or stained through IF for PLIN2 (D). The graph corresponds to the mean number of PLIN2 spots per cell normalized to DAPI (E). (F, G) Spheroids formed by MDA-MB231 (F) or LLC (G) cells were incubated with vehicle or FABP4 Inh (10 μM) for 24 h and spheroid size was quantified using computerized image analysis (n = 4). (H) The migration of MDA-MB231 cells was assessed in glass inserts in the presence of mitomycin. Cells were incubated with vehicle or FABP4 Inh (10 μM) and allowed to migrate for 48 h. Graph corresponds to the quantification of cell surface area occupied by migrating cells as percentage by subtracting the surface area occupied at time t0 (n = 3). (I) Measurement of ROS levels in MDA-MB231 and LLC cells treated in vitro with increasing concentrations of FABP4 Inh (1–15 μM). (J) Western blot analysis of oxidative stress (TXNIP and catalase) and ferroptosis (GPX4) markers in MDA-MB231 (left) and LLC (right) cells incubated under normoxia or hypoxia, and treated or not for 24 h with FABP4 Inh (10 μM). Graphs correspond to densitometry quantifications of western blots for TxNIP, catalase, and GPX4 (n = 3). (K, L) Cell viability of MDA-MB231 (K) and LLC (L) cells pretreated for 2 h with vehicle (control), N-acetyl cysteine (NAC) or erastin and incubated for 30 min with H2O2 (100 μM). % of viability was determined by the ratio of cell incubated with H2O2/untreated cells (n = 4). (M, N) Cell viability of MDA-MB231 (M) and LLC (N) cells after pharmacological inhibition of FABP4 by FABP4 Inh (5 and 10 μM) for 2 h and incubation with H2O2 (100 μM) for 30 min. % of viability was determined by the ratio of cell incubated with H2O2/untreated cells (n = 4). (O, P) Cell viability of MDA-MB231 (O) and LLC (P) cells pretreated for 2 h with deferoxamine (DFO) (100 μM), erastin (10 μM) and FABP4 Inh (10 μM) and incubated for 30 min with H2O2 (100 μM). % of viability was determined by the ratio of cell incubated with H2O2/untreated cells (n = 4). Statistical analysis was performed with Matlab software for LD counting in (A) and ANOVA for (E–P). *P ≤ 0,05; **P ≤ 0,01; ***P ≤ 0,001. (For interpretation of the references to color in this figure legend, the reader is referred to the Web version of this article.)
Fig. 5
Fig. 5
Cancer cell-derived SCD1 enhanced cell migration and protection from ROS-induced ferroptosis (A) Western blot analysis of SCD1 expression in LLC and MDA-MB231 cells incubated with shRNA against SCD1 (shSCD1) and control shRNA (shNT). (B, C) Inhibition of spheroid growth of MDA-MB231 (B) and LLC cells (C) by SCD1 inhibitor (SCD1 Inh). (D, E) Inhibition of spheroid growth by shRNA directed against SCD1: shSCD1 n°1 and n°2 for MDA-MB231 cells (D); shSCD1 n°3 and n°4 for LLC cells (E) compared to their respective control cells (shNT). Graphs are the quantifications of spheroid growth diameter (mm3) (n = 3). (F) Spheroid formed by LLC cells expressing shSCD1 (n°3 and n°4) were supplemented or not with unsaturated fatty acids (C16:1), palmitoleic acid (PA), in culture media. Graphs are the quantifications of spheroid growth diameter (mm3) (n = 3). (G, H) Seahorse analyses of oxygen consumption rates (OCR) upon SCD1 depletion. Kinetic OCR response of MDA-MB231 (G) and LLC (H) cells (transduced with control shRNA (shNT) or anti-SCD1 shRNAs after incubation with oligomycin (O, 1 μM), FCCP (F, 1 μM), rotenone and antimycin A mix (R/A, 0.5 μM each). Seahorse assay readouts were normalized to cell number using Hoechst incorporation (arbitrary unit, A.U.). Data are presented as mean ± SD, (n = 3). (I, J) Cell proliferation assessment by Incucyte of MDA-MB231 cells expressing shRNAs directed against SCD1 or control shRNA (shNT) (I), and in (J) by pharmacological inhibition of SCD1 by SCD1 Inh. (K, L) Cell proliferation assessment by IncuCyte® of LLC cells expressing shRNAs directed against SCD1 or control shRNA (shNT) (K), and in (L) by pharmacological inhibition of SCD1 by SCD1 Inh. (M, N) Cell viability of MDA-MB231 (M) and LLC (N) cells after pharmacological inhibition of SCD1 by SCD1 Inh (10 and 20 μg/ml) for 2 h and incubation with H2O2 (100 μM) for 30 min % of viability was determined by the ratio of cell incubated with H2O2/untreated cells (n = 4). (O, P) Cell viability of MDA-MB231 (O) and LLC (P) cells expressing shRNAs directed against SCD1 or control shRNA (shNT) and incubated with H2O2 (100 μM) for 30 min. % of viability was determined by the ratio of cell incubated with H2O2/untreated cells (n = 4). (Q, R) Cell viability of LLC (Q) and MDA-MB231 (R) cells pretreated for 2 h with deferoxamine (DFO) (100 μM), erastin (10 μM) and SCD1 Inh (10 μg/ml) and incubated for 30 min with H2O2 (100 μM). % of viability was determined by the ratio of cell incubated with H2O2/untreated cells (n = 4). *P ≤ 0,05; **P ≤ 0,01; ***P ≤ 0,001.
Fig. 6
Fig. 6
Lipid transport and desaturation drive ferroptosis resistance and tumor recurrence in vivo (A, B) Tumor growth curves of MDA-MB231 xenografts (A) or LLC tumors (B) treated (double headed arrow) with TKI and/or FABP4 Inh (40 mg/kg/day) (n = 6). (C, D) Tumor growth curves of MDA-MB231 xenografts (C) and LLC tumors (D) expressing control shRNA (shNT) or shRNA against SCD1 (n = 6). (E, F) Tumor growth curves of MDA-MB231 xenografts (E) or LLC tumors (F) treated (double headed arrow) with TKI and/or SCD Inh (n = 6). (G, H) Images of IHC analysis of GPX4 (G) and computerized quantification of GPX4 staining density (H) in whole tumor sections of LLC tumors treated with vehicle (control) or TKI treatment and discontinuation (Hypoxia/Reox) in (B and F), followed by SCD1 Inh (hypoxia/Reox + SCD Inh) in (F) or by FABP4 Inh (Hypoxia/Reox + FABP Inh) in (B) (n = 5). (I) Images representative of HNE staining in LLC tumors expressing shRNA against SCD1 or control shRNA (sh-NT) of tumors in (D), including control tumor (vehicle), tumors in hypoxia (TKI) and tumor in Hypoxia/Reox, after TKI cessation. HNE deposition in cancer cells is showed by white arrows in the pictures. (J) Tumor growth curves of LLC tumors in mice treated or not with a combination of RSL3 and TKI (Hypoxia + RSL3/Reox + RSL3) or after TKI cessation (Hypoxia/Reox + RSL3) (n = 5). (K) Tumor growth curves of LLC tumors in mice treated with vehicle, TKI and cessation (Hypoxia/Reox) and followed by FABP4 Inh alone (Hypoxia/Reox + FABP4 Inh) or a combination of FABP Inh with and SCD1 Inh (Hypoxia/Reox + FABP4 Inh + SCD Inh) (n = 6). *P ≤ 0,05; **P ≤ 0,01; ***P ≤ 0,001; ****P ≤ 0,0001 (M) Schematic overviw of the main findings. Residual tumors have increased expression of FABP4 in TECs and adipocytes that sustains LD formation within cancer cells and resistance to ferroptosis. While residual tumors have increased expression of GPX4, they show resistance to RSL3. Reoxygenation of residual tumors promotes lipid desaturation by SCD1 and promotes cell migration and protection from ferroptosis. Inhibition of SCD1 and FABP4 sensitized tumors to ferroptotic cell death and abolished tumor recurrence.

References

    1. Mahvi D.A., Liu R., Grinstaff M.W., Colson Y.L., Raut C.P. Local cancer recurrence: the realities, challenges, and opportunities for new therapies, CA. Cancer J. Clin. 2018;68 doi: 10.3322/caac.21498. - DOI - PMC - PubMed
    1. Ackerman D., Simon M.C. Hypoxia, lipids, and cancer: surviving the harsh tumor microenvironment. Trends Cell Biol. 2014;24:472–478. doi: 10.1016/j.tcb.2014.06.001. - DOI - PMC - PubMed
    1. Harris A.L. Hypoxia--a key regulatory factor in tumour growth. Nat. Rev. Canc. 2002;2:38–47. http://www.ncbi.nlm.nih.gov/entrez/query.fcgi?cmd=Retrieve&db=PubMed&dop... - PubMed
    1. Reczek C.R., Chandel N.S. The two faces of reactive oxygen species in cancer. Annu. Rev. Cell Biol. 2017;1:79–98. doi: 10.1146/annurev-cancerbio-041916-065808. - DOI
    1. Manda G., Isvoranu G., Comanescu M.V., Manea A., Debelec Butuner B., Korkmaz K.S. The redox biology network in cancer pathophysiology and therapeutics. Redox Biol. 2015;5:347–357. doi: 10.1016/j.redox.2015.06.014. - DOI - PMC - PubMed

Publication types