

Association between meteorological factors and daily new cases of COVID-19 in 188 countries: A time series analysis
- PMID: 34030332
- PMCID: PMC7986348
- DOI: 10.1016/j.scitotenv.2021.146538
Association between meteorological factors and daily new cases of COVID-19 in 188 countries: A time series analysis
Abstract
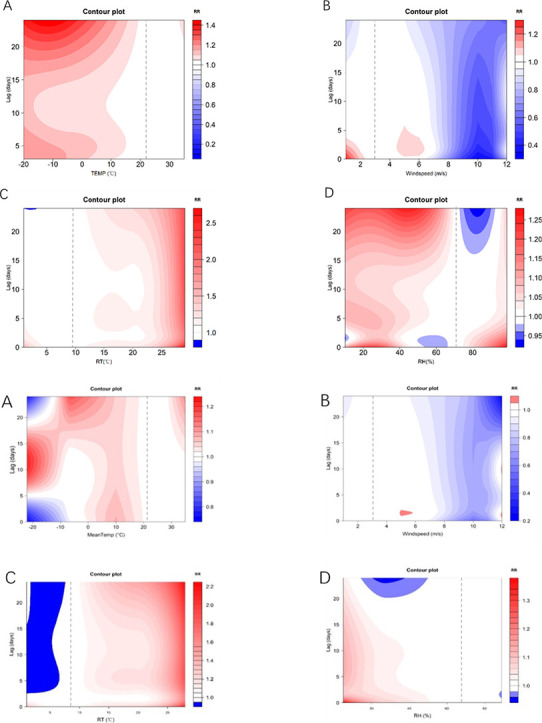
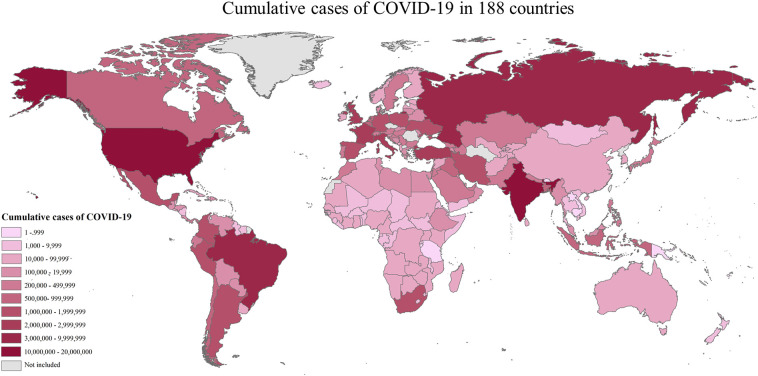
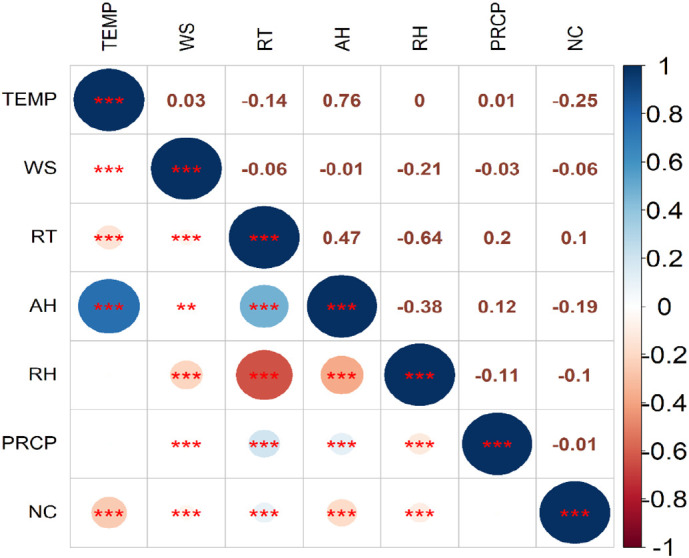
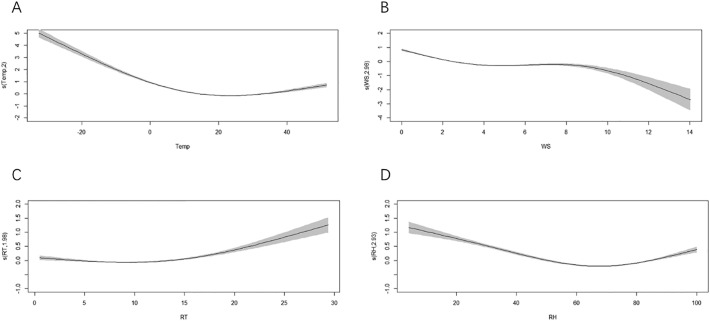
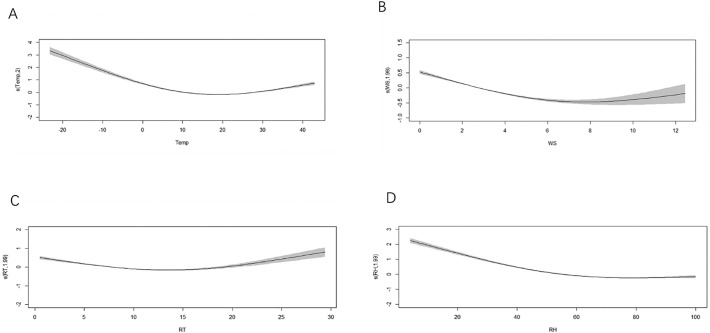
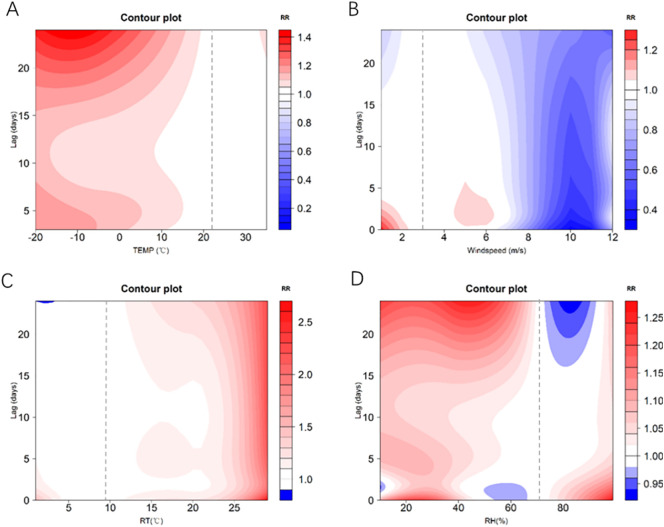
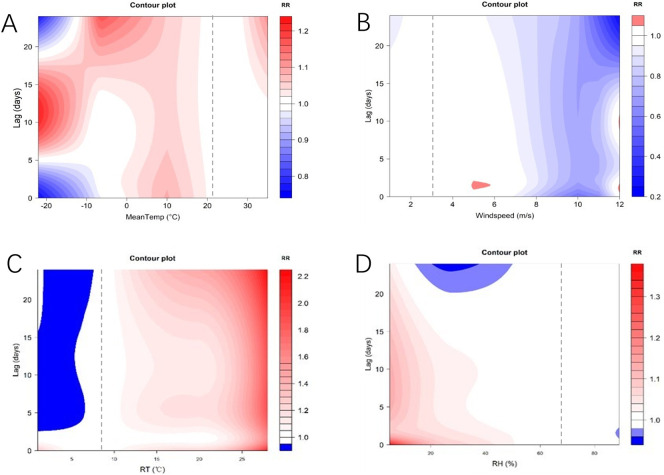
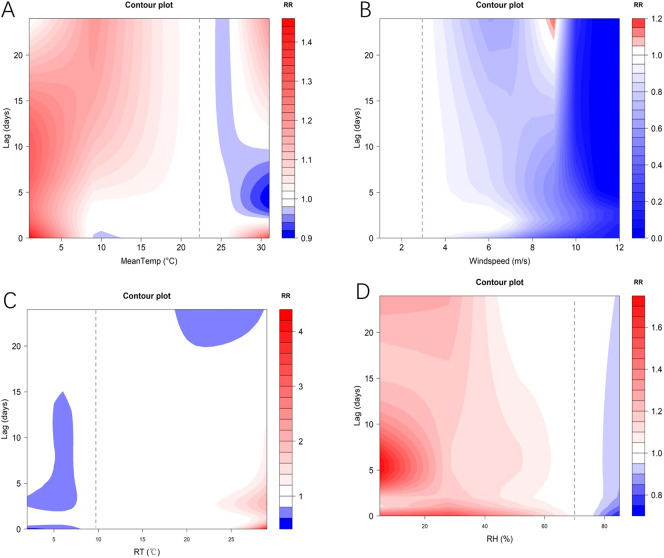
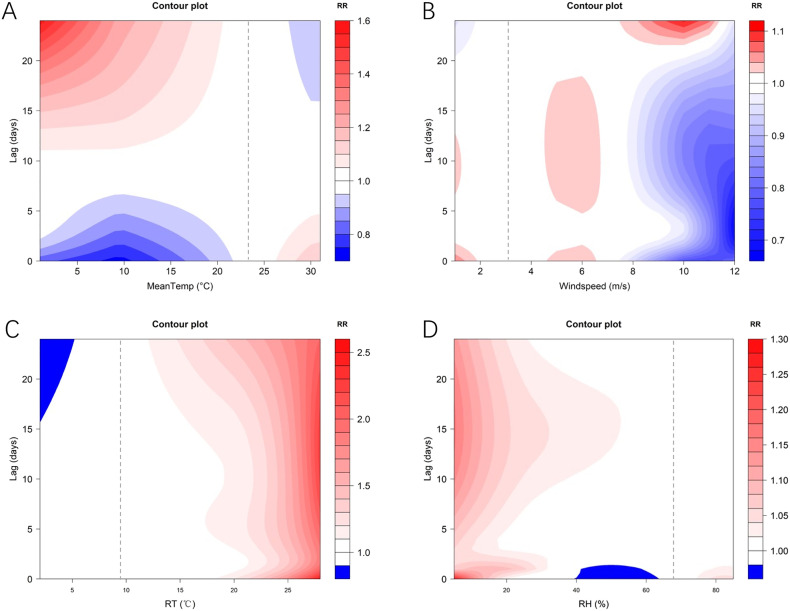
By 31 December 2020, Coronavirus disease 2019 (COVID-19) had been prevalent worldwide for one year, and most countries had experienced a complete seasonal cycle. The role of the climate and environment are essential factors to consider in transmission. We explored the association between global meteorological conditions (including mean temperature, wind speed, relative humidity and diurnal temperature range) and new cases of COVID-19 in the whole past year. We assessed the relative risk of meteorological factors to the onset of COVID-19 by using generalized additive models (GAM) and further analyzed the hysteresis effects of meteorological factors using the Distributed Lag Nonlinear Model (DLNM). Our findings revealed that the mean temperature, wind speed and relative humidity were negatively correlated with daily new cases of COVID-19, and the diurnal temperature range was positively correlated with daily new cases of COVID-19. These relationships were more apparent when the temperature and relative humidity were lower than their average value (21.07°Cand 66.83%). The wind speed and diurnal temperature range were higher than the average value(3.07 m/s and 9.53 °C). The maximum RR of mean temperature was 1.30 under -23°C at lag ten days, the minimum RR of wind speed was 0.29 under 12m/s at lag 24 days, the maximum RR of range of temperature was 2.21 under 28 °C at lag 24 days, the maximum RR of relative humidity was 1.35 under 4% at lag 0 days. After a subgroup analysis of the countries included in the study, the results were still robust. As the Northern Hemisphere enters winter, the risk of global covid-19 remains high. Some countries have ushered in a new round of COVID-19 epidemic. Thus, active measures must be taken to control the source of infection, block transmission and prevent further spread of COVID-19 in winter.
Keywords: COVID-19; Humidity; Relative; Temperature; Wind speed.
Copyright © 2021 The Authors. Published by Elsevier B.V. All rights reserved.
Conflict of interest statement
Declaration of competing interest The authors declare that they have no known competing financial interests or personal relationships that could have influenced the work reported in this paper.
Figures
Similar articles
-
Non-linear correlation between daily new cases of COVID-19 and meteorological factors in 127 countries.Environ Res. 2021 Feb;193:110521. doi: 10.1016/j.envres.2020.110521. Epub 2020 Dec 3. Environ Res. 2021. PMID: 33279492 Free PMC article.
-
Effects and Interaction of Meteorological Factors on Pulmonary Tuberculosis in Urumqi, China, 2013-2019.Front Public Health. 2022 Jul 14;10:951578. doi: 10.3389/fpubh.2022.951578. eCollection 2022. Front Public Health. 2022. PMID: 35910866 Free PMC article.
-
Meteorological factors and COVID-19 incidence in 190 countries: An observational study.Sci Total Environ. 2021 Feb 25;757:143783. doi: 10.1016/j.scitotenv.2020.143783. Epub 2020 Nov 23. Sci Total Environ. 2021. PMID: 33257056 Free PMC article.
-
Association of sudden sensorineural hearing loss with meteorological factors: a time series study in Hefei, China, and a literature review.Environ Sci Pollut Res Int. 2024 Jun;31(30):42970-42990. doi: 10.1007/s11356-024-33943-1. Epub 2024 Jun 17. Environ Sci Pollut Res Int. 2024. PMID: 38886269 Free PMC article. Review.
-
Association of Short-Term Exposure to Meteorological Factors and Risk of Hand, Foot, and Mouth Disease: A Systematic Review and Meta-Analysis.Int J Environ Res Public Health. 2020 Oct 30;17(21):8017. doi: 10.3390/ijerph17218017. Int J Environ Res Public Health. 2020. PMID: 33143315 Free PMC article.
Cited by
-
Warmer ambient air temperatures reduce nasal turbinate and brain infection, but increase lung inflammation in the K18-hACE2 mouse model of COVID-19.Sci Total Environ. 2023 Feb 10;859(Pt 1):160163. doi: 10.1016/j.scitotenv.2022.160163. Epub 2022 Nov 14. Sci Total Environ. 2023. PMID: 36395835 Free PMC article.
-
Environmental predictors of SARS-CoV-2 infection incidence in Catalonia (northwestern Mediterranean).Front Public Health. 2024 Dec 5;12:1430902. doi: 10.3389/fpubh.2024.1430902. eCollection 2024. Front Public Health. 2024. PMID: 39703486 Free PMC article.
-
Causal effect of air pollution and meteorology on the COVID-19 pandemic: A convergent cross mapping approach.Heliyon. 2024 Jan 26;10(3):e25134. doi: 10.1016/j.heliyon.2024.e25134. eCollection 2024 Feb 15. Heliyon. 2024. PMID: 38322928 Free PMC article.
-
The influence of meteorological variables and lockdowns on COVID-19 cases in urban agglomerations of Indian cities.Stoch Environ Res Risk Assess. 2022;36(9):2949-2960. doi: 10.1007/s00477-021-02160-4. Epub 2022 Jan 25. Stoch Environ Res Risk Assess. 2022. PMID: 35095340 Free PMC article.
-
Cumulative effects of air pollution and climate drivers on COVID-19 multiwaves in Bucharest, Romania.Process Saf Environ Prot. 2022 Oct;166:368-383. doi: 10.1016/j.psep.2022.08.042. Epub 2022 Aug 20. Process Saf Environ Prot. 2022. PMID: 36034108 Free PMC article.
References
MeSH terms
LinkOut - more resources
Full Text Sources
Other Literature Sources
Medical
Research Materials
Miscellaneous
