High-throughput miRNA sequencing of the human placenta: expression throughout gestation
- PMID: 34030457
- PMCID: PMC8244582
- DOI: 10.2217/epi-2021-0055
High-throughput miRNA sequencing of the human placenta: expression throughout gestation
Abstract
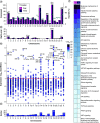
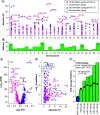
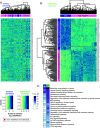
Aim: To understand miRNA changes across gestation in healthy human placentae. This is essential before miRNAs can be used as biomarkers or prognostic indicators during pregnancy. Materials & methods: Using next-generation sequencing, we characterize the normative human placenta miRNome in first (n = 113) and third trimester (n = 47). Results & conclusion: There are 801 miRNAs expressed in both first and third trimester, including 182 with similar expression across gestation (p ≥ 0.05, fold change ≤2) and 180 significantly different (false discovery rate <0.05, fold change >2). Of placenta-specific miRNA clusters, chromosome 14 miRNA cluster decreases across gestation and chromosome 19 miRNA cluster is overall highly expressed. Chromosome 13 clusters are upregulated in first trimester. This work provides a rich atlas of healthy pregnancies to direct functional studies investigating the epigenetic differences in first and third trimester placentae.
Keywords: chorionic villi; gestational differences; human transcriptome; miRNA; miRNA atlas; miRNome; placenta; pregnancy; stable miRNAs; uncomplicated pregnancies.
Plain language summary
Lay abstract The human body produces miRNAs which affect the expression of genes and proteins. This study uses next-generation sequencing to identify the miRNA profile of first and third trimester human placentae using a large cohort (n = 113 first trimester; n = 47 third trimester). All pregnancies resulted in healthy babies. We identify miRNAs with significantly different expression between first and third trimester, as well as stably expressed miRNAs. This work provides a baseline for future studies which may use miRNAs to monitor maternal–fetal health throughout pregnancy.
Conflict of interest statement
This work was supported by the National Institute of Health grants: R01 HD091773, R01 HD074368, T32 DK007770 and U01 EB026421. The funding agency was not involved in the design, analysis or interpretation of the data reported. The content is solely the responsibility of the authors and does not necessarily represent the official views of the National Institutes of Health. The authors have no other relevant affiliations or financial involvement with any organization or entity with a financial interest in or financial conflict with the subject matter or materials discussed in the manuscript apart from those disclosed.
No writing assistance was utilized in the production of this manuscript.
Figures


Similar articles
-
Sex differences in microRNA expression in first and third trimester human placenta†.Biol Reprod. 2022 Mar 19;106(3):551-567. doi: 10.1093/biolre/ioab221. Biol Reprod. 2022. PMID: 35040930 Free PMC article.
-
High-throughput mRNA-seq atlas of human placenta shows vast transcriptome remodeling from first to third trimester†.Biol Reprod. 2024 May 9;110(5):936-949. doi: 10.1093/biolre/ioae007. Biol Reprod. 2024. PMID: 38271627 Free PMC article.
-
High-throughput mRNA sequencing of human placenta shows sex differences across gestation.Placenta. 2024 May;150:8-21. doi: 10.1016/j.placenta.2024.03.005. Epub 2024 Mar 21. Placenta. 2024. PMID: 38537412 Free PMC article.
-
Pregnancy-associated miRNA-clusters.J Reprod Immunol. 2013 Mar;97(1):51-61. doi: 10.1016/j.jri.2012.11.001. J Reprod Immunol. 2013. PMID: 23432872 Review.
-
Peroxisome Proliferator-Activated Receptors (PPAR), fatty acids and microRNAs: Implications in women delivering low birth weight babies.Syst Biol Reprod Med. 2021 Feb;67(1):24-41. doi: 10.1080/19396368.2020.1858994. Syst Biol Reprod Med. 2021. PMID: 33719831 Review.
Cited by
-
Role of microRNAs in trophoblast invasion and spiral artery remodeling: Implications for preeclampsia.Front Cell Dev Biol. 2022 Oct 3;10:995462. doi: 10.3389/fcell.2022.995462. eCollection 2022. Front Cell Dev Biol. 2022. PMID: 36263015 Free PMC article. Review.
-
Circulating extracellular vesicles exhibit a differential miRNA profile in gestational diabetes mellitus pregnancies.PLoS One. 2022 May 25;17(5):e0267564. doi: 10.1371/journal.pone.0267564. eCollection 2022. PLoS One. 2022. PMID: 35613088 Free PMC article.
-
Hypoxia-inducible factor 1 signaling drives placental aging and can provoke preterm labor.Elife. 2023 Aug 23;12:RP85597. doi: 10.7554/eLife.85597. Elife. 2023. PMID: 37610425 Free PMC article.
-
An atlas of small non-coding RNAs in human preimplantation development.Nat Commun. 2024 Oct 5;15(1):8634. doi: 10.1038/s41467-024-52943-w. Nat Commun. 2024. PMID: 39367016 Free PMC article.
-
Leveraging chorionic villus biopsies for the derivation of patient-specific trophoblast stem cells.Commun Biol. 2025 Jul 1;8(1):964. doi: 10.1038/s42003-025-08393-1. Commun Biol. 2025. PMID: 40596474 Free PMC article.
References
-
- Cross JC. Formation of the placenta and extraembryonic membranes. Ann. NY Acad. Sci. 857, 23–32 (1998). - PubMed
-
- Xu P, Wang Y-l, Piao Y-S et al. Effects of matrix proteins on the expression of matrix metalloproteinase-2, -9, and -14 and tissue inhibitors of metalloproteinases in human cytotrophoblast cells during the first trimester1. Biol. Reprod. 65(1), 240–246 (2001). - PubMed
Publication types
MeSH terms
Substances
Grants and funding
LinkOut - more resources
Full Text Sources
Other Literature Sources
Molecular Biology Databases
